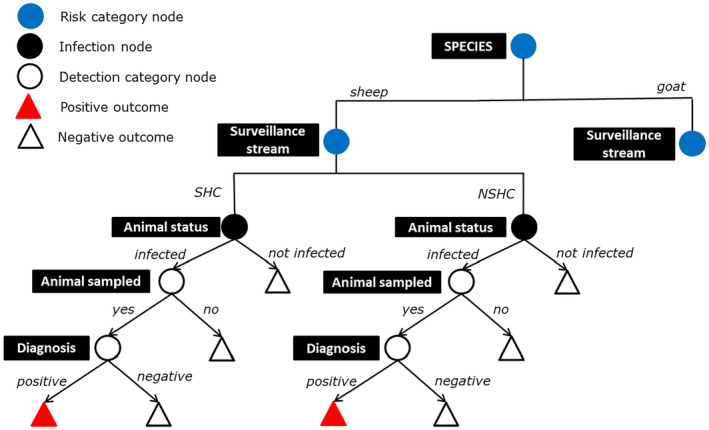
Figure 1.

Scenario tree flow diagram of the analysis of the active surveillance system for CS
- Only the sheep section is shown. The same tree applies to the goat section.

Scenario tree flow diagram of the analysis of the active surveillance system for CS