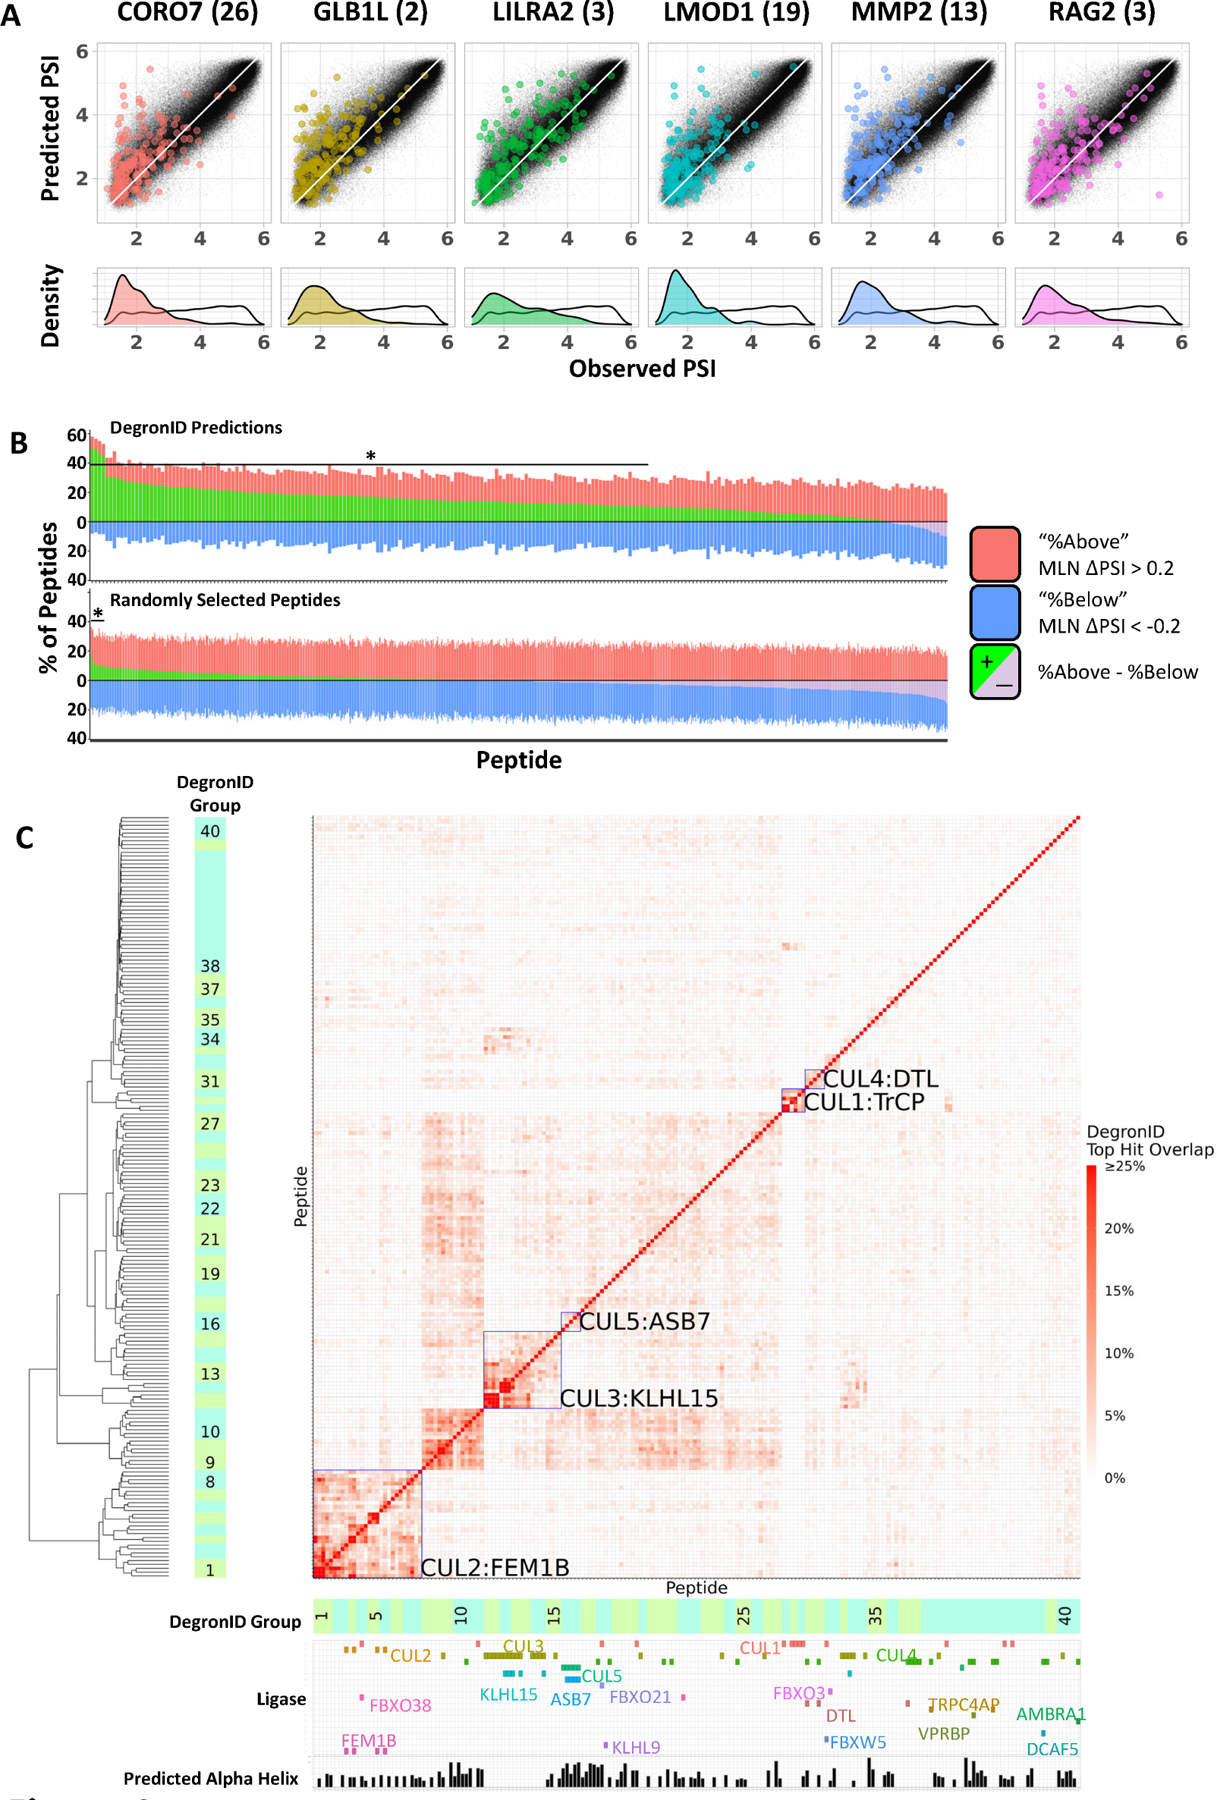
Figure 4: Degron ID classified saturation mutagenesis motifs into clusters based on their sequence similarities.

(A) Distribution of peptides in terms of PSI observed in GPS screen (x) and composition-based PSI prediction (y) from the 260k library (black) and the top 200 scoring hits by DegronID (color).
(B) Summary of top 200 hits by DegronID by MLN ΔPSI for (top) DegronID predictions for 198 CRL peptides; (bottom) iterations of random selections of 200 peptides from our 260k library. The bracket and asterisk indicate the instances for which the value of the green bar is greater than or equal to that which would be expected with an FDR of 0.1.
(C) Hierarchical clustering of saturation mutagenesis degron footprints. Alpha helical structure predictions and paired ligases from validation experiments are indicated below the clustergram. Meta-clusters that correspond to groups of degrons with multiple members sharing the same CRL are boxed and labelled (see Figure S3). See also Figure S2.
