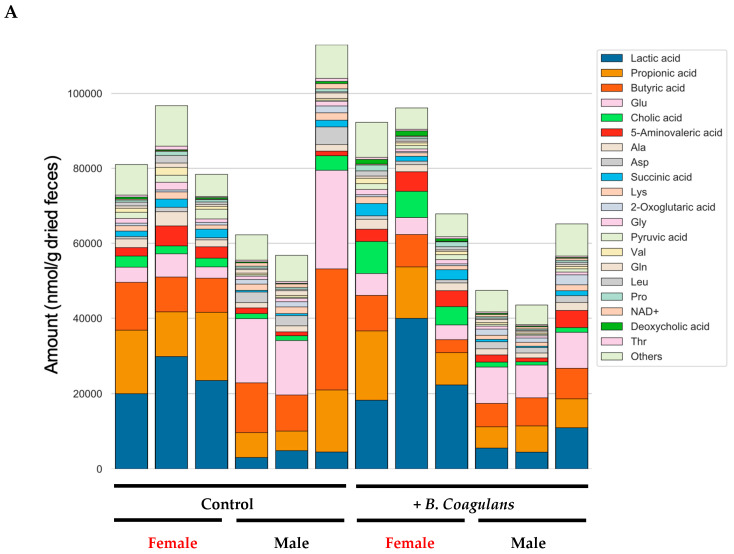
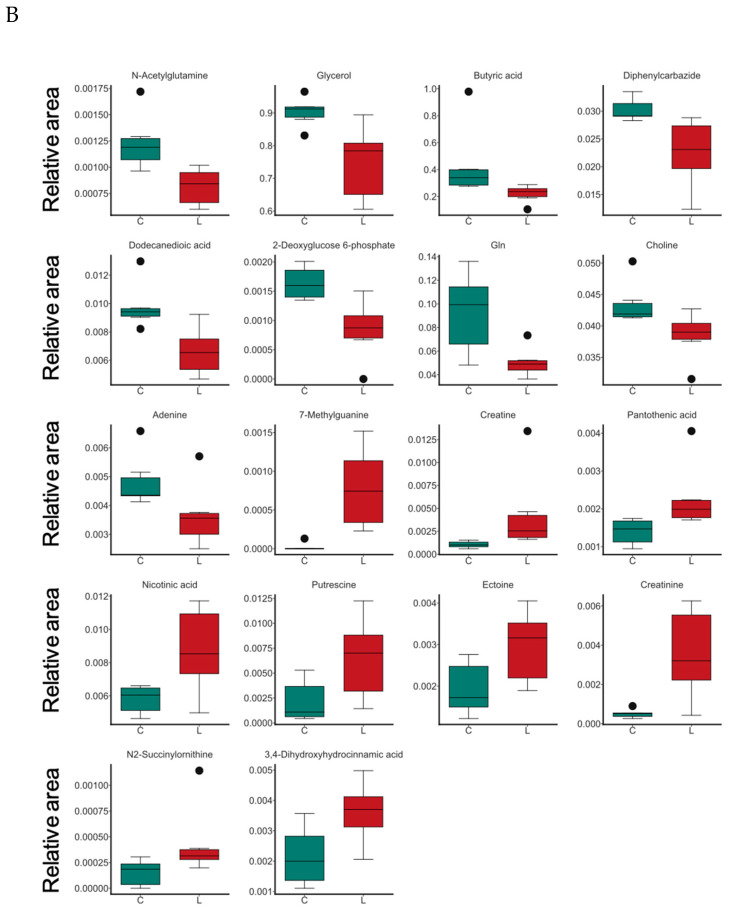
Figure 6.
Effect of B. coagulans administration on the fecal metabolite profile and metabolites with significant differences in relative area ratios. Of the fecal metabolites identified in this study, the quantified 89 types of metabolites are shown in stacked bar graphs (A). The 20 metabolites with the highest average amount in all samples were color-coded, and the other metabolites were labeled “Others”. The relative area ratios of the control group and the lactic acid bacteria intake group were compared between the two groups (Wilcoxon’s rank sum test), and the relative area ratios of the metabolites showing significant differences are shown in boxplots (B). (B) shows the results for all mice including male and female. C, control group; L, B. coagulans. The values are presented as mean ± SD of three animals. Significant differences were observed between C and L in all parameters (p < 0.05).


