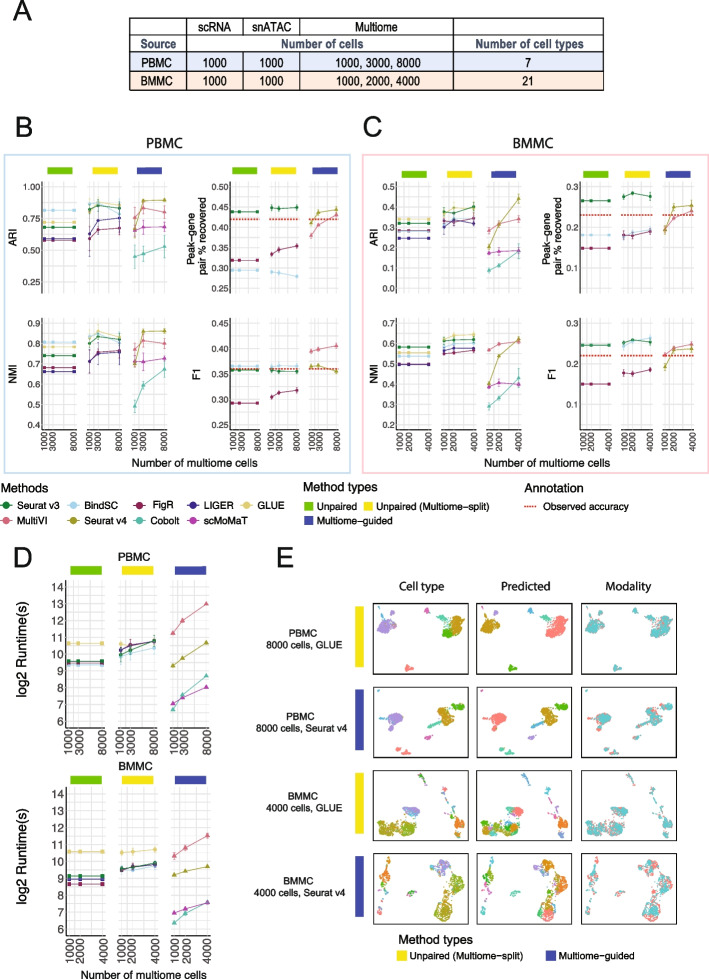
Fig. 2.
Comparison of integration performance without vs. with multiome cells. A The number of cells and cell types for each simulated dataset using the PBMC or BMMC multiome data as the ground truth. B, C Performance of cell type annotation and peak-gene association recovery in the PBMC-based simulations (B) and BMMC-based simulations (C). ARI and NMI measure agreement between predicted cell type and ground-truth labels. Peak-gene pair % recovered is the percentage of peak-gene pairs correctly identified compared to the ground-truth list calculated using 10,412 paired PBMC cells (B) and 6740 BMMC cells (C). F1 is the prediction accuracy normalized by the number of false positives and false negatives. The dashed line shows the percent recovery and F1 score calculated using 1000 multiome cells. Error bar is mean ± standard deviation. D Runtime measured in seconds, for each method, in log2 scale. Error bar is mean ± standard deviation. E UMAP projection using integrated embedding for a select number of methods. UMAP projection for the other methods are shown in Additional file 1: Fig. S3 (PBMC) and Additional file 1: Fig. S4 (BMMC)

