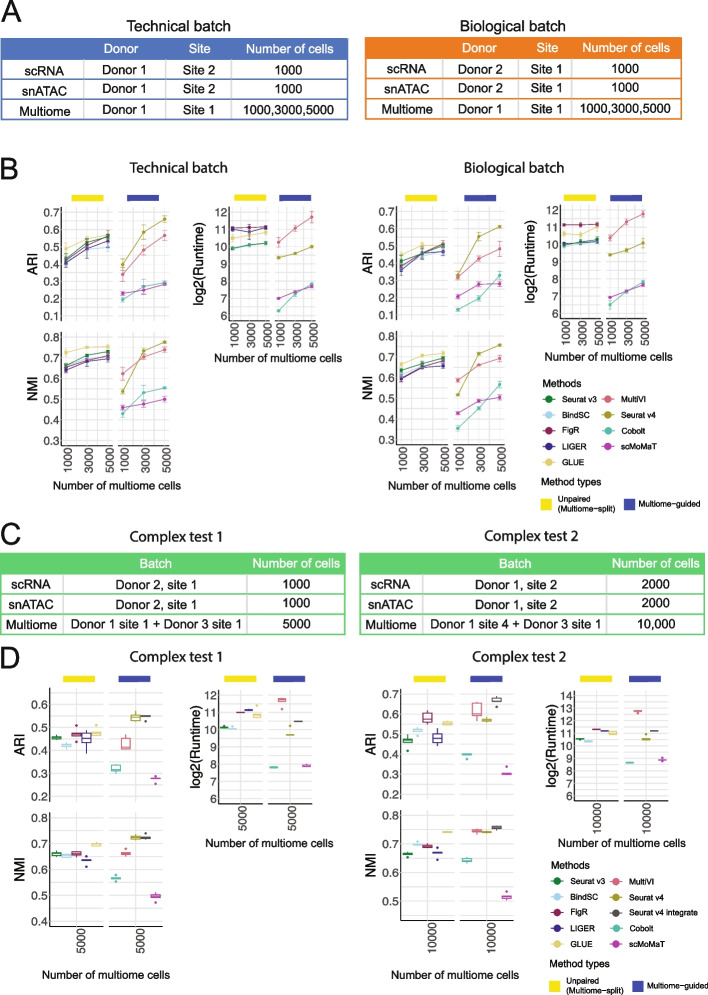
Fig. 5.
Evaluation of integration performance in the presence of batch effects. A Simulation details for the constructed data with technical batches and biological batches. B Performance of cell type annotation and runtime in the presence of technical and biological batches shown in A. ARI and NMI measure agreement between predicted cell type and ground-truth labels. Runtime is measured in seconds, for each method, in log2 scale. Error bar is mean ± standard deviation. C Simulation details for two datasets with more complex batch structures. D Performance of cell type annotation and runtime in the presence of technical and biological batches shown in C. ARI and NMI measure agreement between predicted cell type and ground-truth labels. Runtime is measured in seconds, for each method, in log2 scale. Whisker is 1.5 times the inter-quartile range

