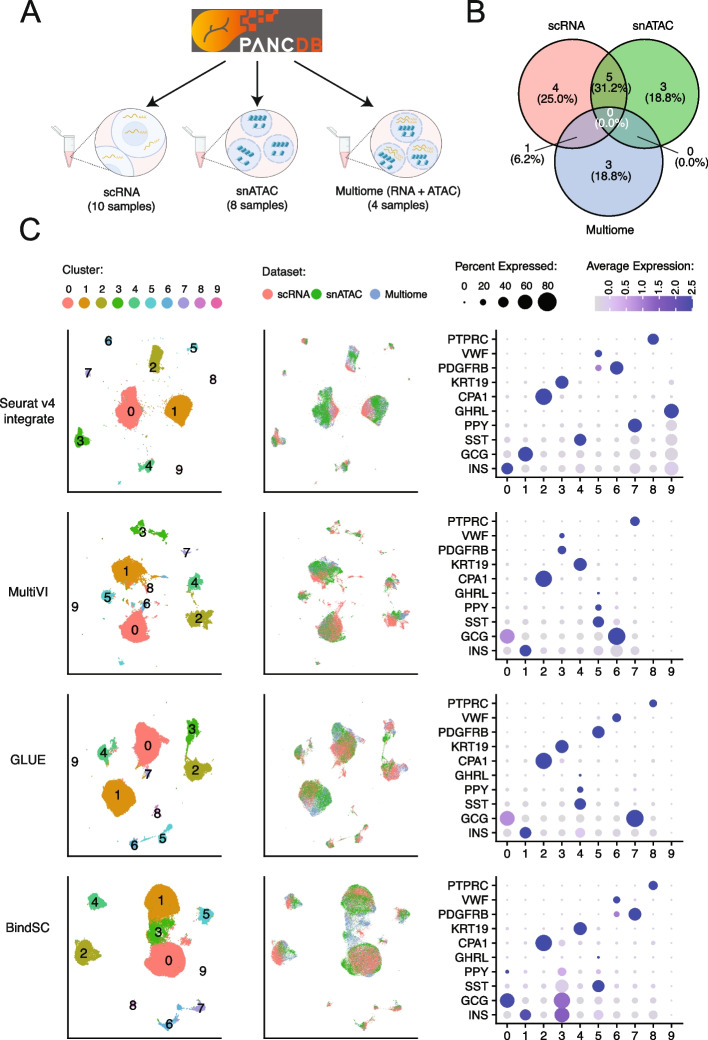
Fig. 6.
Integration of scRNA-seq, snATAC-seq, and multiome datasets from the Human Pancreas Analysis Program (HPAP). A Illustration of the number of samples for each data type from PANC-DB, the website releasing all HPAP datasets. B Overlap of samples from the same human donor between data types. C Integration results: UMAP projection using integrated embedding for a select number of methods, colored by cluster ID (left), data type (middle), and dot-plots showing the expression of marker genes per cluster, colored by average expression, sized by the percentage of cells expressing the gene (right). Integration results of the rest of the methods and other evaluation metrics are shown in Additional file 1: Fig. S17

