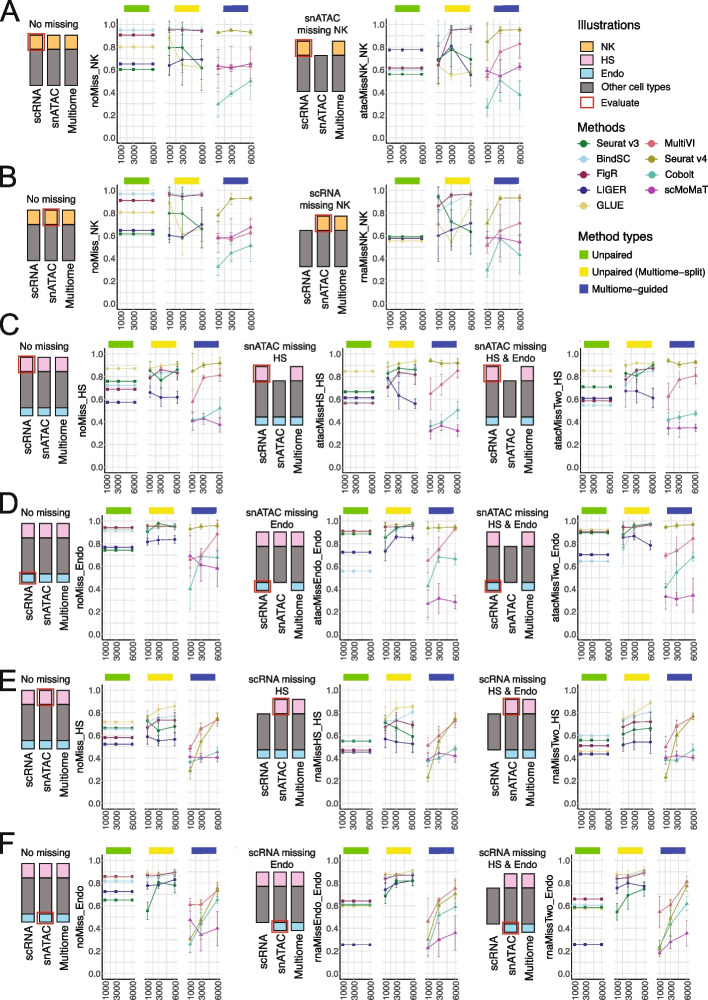
Fig. 7.
Evaluation of rare cell recovery when one of the single-modality datasets miss the rare population of cells. A, B F1 score of recovering “Natural Killer” (NK) cells in PBMC-simulated situations. A F1 score of recovering NK cells in scRNA-seq at the baseline situation (left) and when snATAC-seq does not have NK cells (right). B F1 score of recovering NK cells in snATAC-seq at the baseline situation (left) and when scRNA-seq does not have NK cells (right). C–F F1 scores of recovering “Hair Shaft” (HS) cells or “Endothelial” (Endo) cells in SHARE-seq-simulated situations. C F1 score of recovering HS cells in scRNA-seq at the baseline situation (left), versus when snATAC-seq does not have HS cells (middle), versus when snATAC-seq does not have HS and Endo cells (right). D F1 score of recovering Endo cells in scRNA-seq at the baseline situation (left), versus when snATAC-seq does not have Endo cells (middle), versus when snATAC-seq does not have HS and Endo cells (right). E F1 score of recovering HS cells in snATAC-seq at the baseline situation (left), versus when scRNA-seq does not have HS cells (middle), versus when scRNA-seq does not have HS and Endo cells (right). F F1 score of recovering Endo cells in snATAC-seq at the baseline situation (left), versus when scRNA-seq does not have Endo cells (middle), versus whens cRNA-seq does not have HS and Endo cells (right). For all subplots, error bar is mean ± standard deviation

