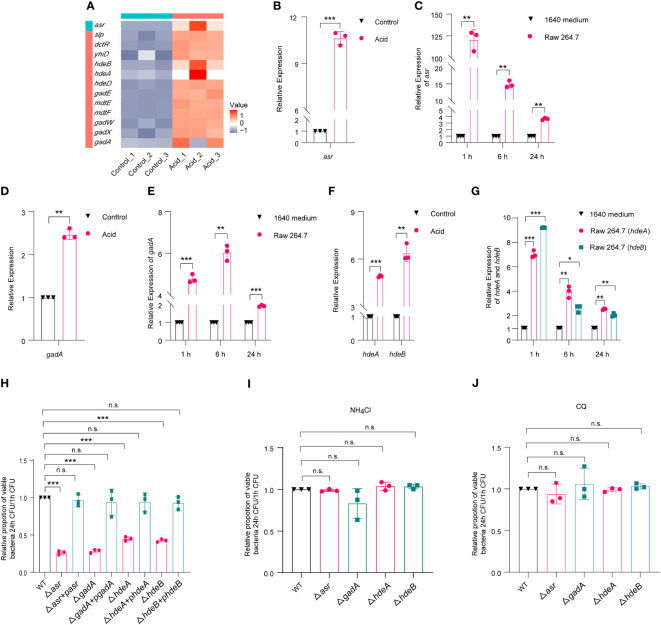
Figure 3.
E. coli acid shock and fitness genes affect the replication of LF82 in macrophages. (A) Heat map of acid fitness genes expression of LF82 under acid treatment. (B) qRT-PCR detected the expression of asr in LF82 under acid treatment. (C) qRT-PCR detected the expression of asr in LF82-infected macrophages at indicated time point. (D) qRT-PCR detected the expression of gadA in LF82 under acid treatment. (E) qRT-PCR detected the expression of gadA in LF82-infected macrophages at indicated time point. (F) qRT-PCR detected the expression of hdeA and hdeB in LF82 under acid treatment. (G) qRT-PCR detected the expression of hdeA and hdeB in LF82-infected macrophages at indicated time point. (H) Comparison of intracellular replication between Δasr, Δasr+pasr, ΔgadA, ΔgadA+pgadA, ΔhdeA, ΔhdeA+phdeA, ΔhdeB, ΔhdeB+phdeB and WT at 24 h p.i. (I) Comparison of intracellular replication between Δasr, Δasr+pasr, ΔgadA, ΔgadA+pgadA, ΔhdeA, ΔhdeA+phdeA, ΔhdeB, ΔhdeB+phdeB and WT at 24 h p.i. treated with 30 mM NH4Cl. (J) Comparison of intracellular replication between Δasr, Δasr+pasr, ΔgadA, ΔgadA+pgadA, ΔhdeA, ΔhdeA+phdeA, ΔhdeB, ΔhdeB+phdeB and WT at 24 h p.i. treated with 10 μM CQ. Data were obtained from three independent experiments and analyzed using Student’s t-test. *P < 0.05, **P < 0.01, ***P < 0.001; n.s., not significant.

