Figure 5.
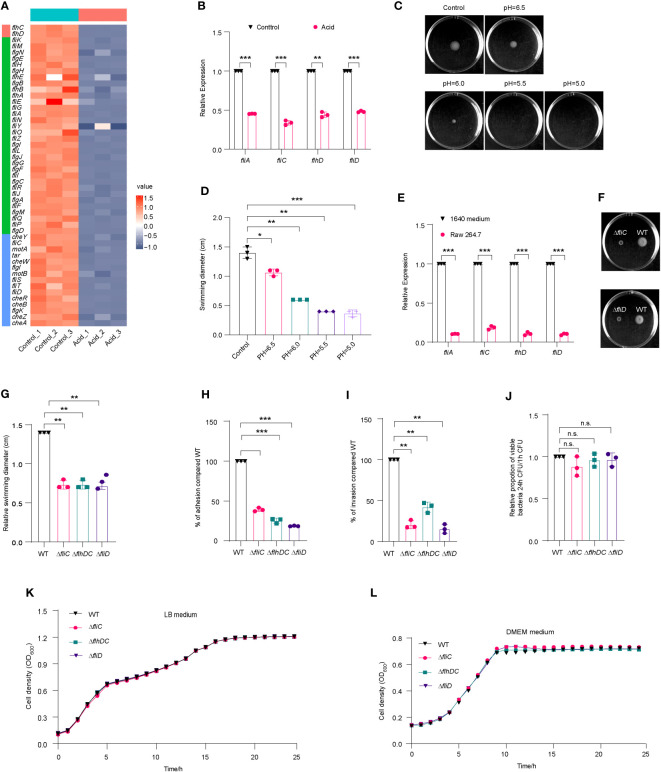
Flagella movement of LF82 was limited under acid treatment and in macrophages. (A) Heat map of flagellar genes expression in transcriptome of LF82 under acid treatment. (B) qRT-PCR verified the expression level of fliA, fliC, flhD, and fliD genes in transcriptome. (C) The motion of LF82 under different pH semisolid mediums. (D) The diameter of swimming circles of LF82 under different pH semisolid mediums. (E) Expression of LF82 flagellar genes in macrophages compared to culture in 1640 medium at 1 h p.i. (F) The motion of ΔfliC and ΔfliD compared to that of WT on semisolid medium. (G) The diameter of swimming circles of ΔfliC and ΔfliD compared that of WT on semisolid medium. (H) Adhesion of ΔfliC and ΔfliD into epithelial cells compared to that of WT at 3 h p.i. (I) Internalization of ΔfliC and ΔfliD into epithelial cells compared to that of WT at 4 h p.i. (J) Replication ability of ΔfliC and ΔfliD in macrophages compared to that of WT. (K) Growth curve of fliC, fliD and WT in LB medium. (L) Growth curve of fliC, fliD and WT in DMEM medium. Data were obtained from three independent experiments and analyzed using Student’s t-test. *P < 0.05, **P < 0.01, ***P < 0.001; n.s., not significant.

