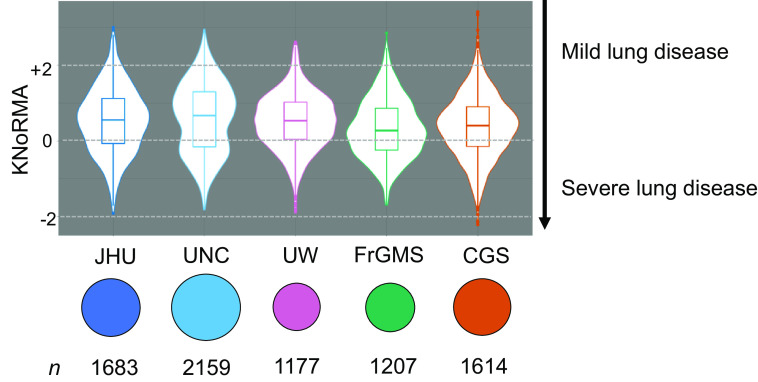
Figure 1.
Distributions of the Kulich normal residual mortality-adjusted (KNoRMA) age-adjusted lung function phenotype by site cohort. The line inside each box is the median KNoRMA, and the box represents the interquartile range, or distance between the first and third quartiles (the 25th and 75th percentiles). Violin plots show the overall population distribution. Sample sizes are shown, with symbol areas proportional to sample size. CGS = Canadian CF Gene Modifier Study (population-based); FrGMS = French CF Gene Modifier Consortium (population-based); JHU = Johns Hopkins University (twin-siblings design); UNC = University of North Carolina (extremes of phenotype); UW = University of Washington (longitudinal study for effect of Pseudomonas aeruginosa acquisition on lung disease).

