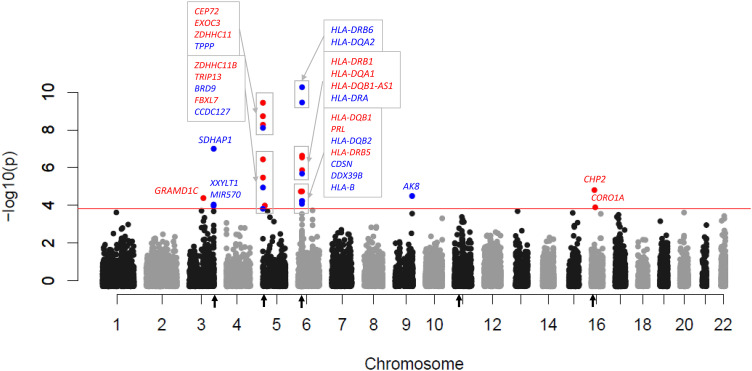
Figure 4.
Significant genes based on transcriptome-wide association (TWAS) evidence for expression versus lung function (Kulich normal residual mortality-adjusted phenotype). Genome-wide Manhattan plot of TWAS associations. The red line corresponds to transcriptome-wide false-discovery q lower than 0.10, with significant genes labeled. Red-colored text corresponds to increased expression associated with improved lung function, and blue-colored text corresponds to increased expression associated with decreased lung function. Regions of significant genome-wide phenotype–genotype association are marked with black arrows on the x-axis.

