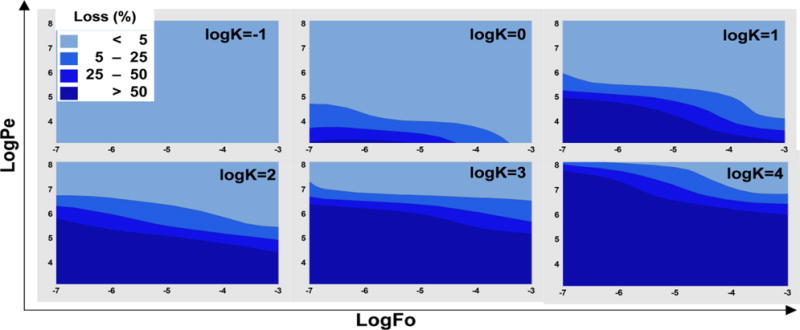
Figure 3. Loss of drug in the PDMS is determined by K, Pe, and Fo.

The COMSOL model was simulated by varying the parameters in the ranges given in Table 1. The percentage loss values were calculated. The model parameters were arranged in logPe and logFo values are presented as surface plots for various K values.
