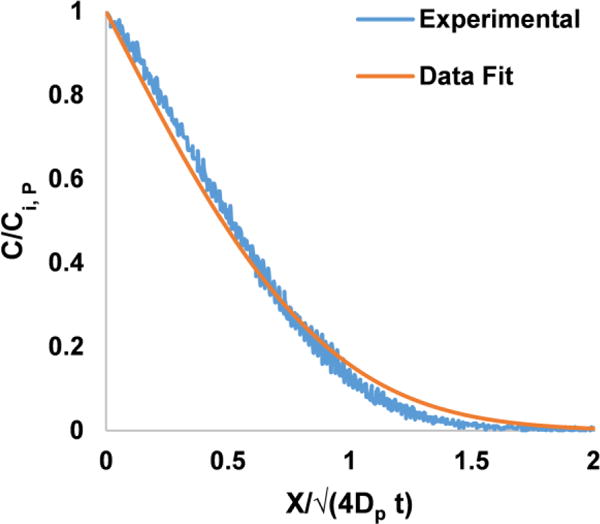
Figure 4. Estimation of rhodamine B diffusion coefficient in PDMS.

Rhodamine dye is perfused through the microfluidic device and the fluorescence was recorded. The gray values normalized with respect to gray values at the wall of the channel (C/Ci, P) were plotted. The experimental data shown is measured in a straight line perpendicular to the surface of the channel, where × = 0. The regression analysis was performed on the experimental data using equation 4.
