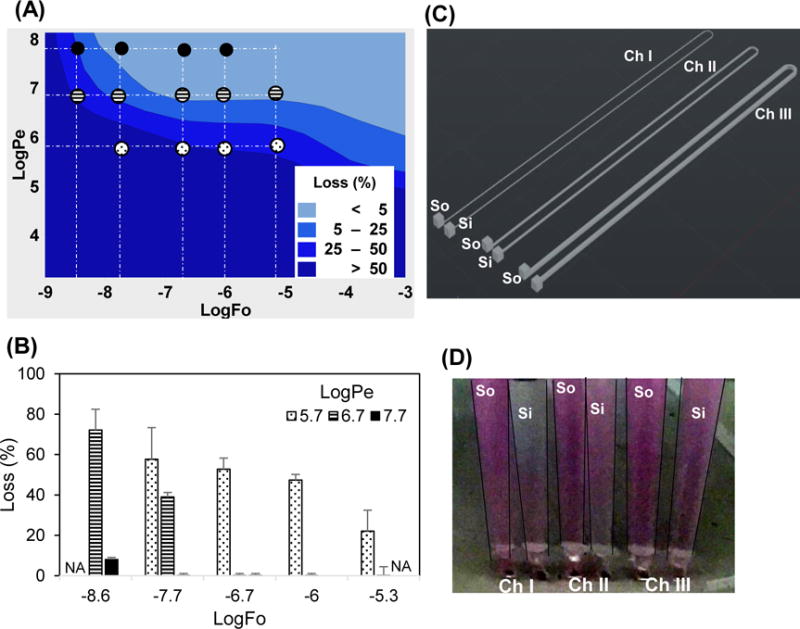
Figure 5. Validation of model data using rhodamine B dye in PDMS.

(A) The COMSOL model was simulated using properties of Rhodamine B. The small circles indicate logFo and logPe coordinates at which the experimental data in panel B is obtained. The pattern of the circles (e.g., filled) correspond to the patterns of the columns in B. (B) The loss due to absorption in PDMS was experimentally determined by spectrophotometric analysis. The experimental measurements not performed are indicated by NA. The error bars are mean ±SD for n≥6. (C) The device design to vary Pe 1, 2.3, and 4 times by changing cross sectional area 100 × 100, 200 × 100, 400 × 100 (w × h) μm and driving flow by simple hydrostatic head. The three channels have separate Source (So) and Sink (Si). (D) The color intensity increases in sinks from channel I to III indicating decreasing loss of dye in PDMS from channel I to III as Pe increases.
