Fig 1.
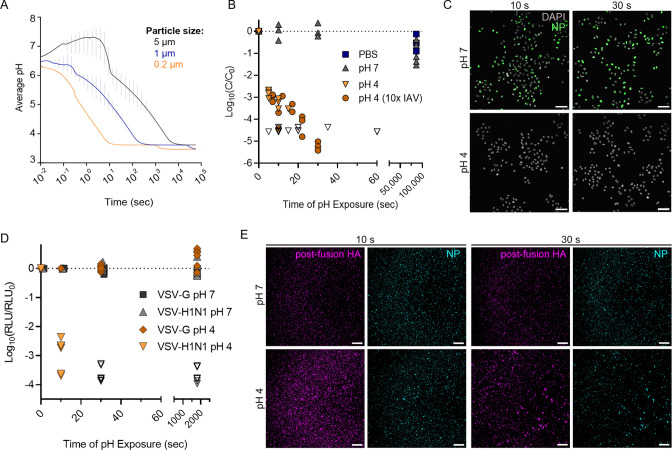
Acidification of an exhaled aerosol and the effect on IAV infectivity. (A) Average pH within an exhaled respiratory aerosol particle as it transitions from the nasal microenvironment to typical indoor air, modeled using ResAM. The particle evaporates with time (in seconds), resulting in acidification down to pH ~3.8. Progressive changes in pH are modeled for particles of three different initial sizes. Vertical error bars indicate the pH range between the innermost and outermost aerosol shells at each time point, with the mean pH presented as a continuous line. Thermodynamic and kinetic properties are those of synthetic lung fluid (SLF), a representative respiratory matrix. The indoor air conditions were set at 20°C and 50% RH, and the exhaled air is assumed to mix into the indoor air using a turbulent eddy diffusion coefficient of 50 cm2/s. (B) Inactivation of IAV due to exposure to acidic pH 4. IAV was spiked into neutral solutions of PBS or pH 7 buffer or spiked into acidic pH 4 buffer. Aliquots were taken at multiple time points post spiking (up to 86,400 s or 24 h) and neutralized for quantification of remaining viral titer by plaque assay. For pH 4 samples, the virus was spiked at 106 PFU/mL or at 107 PFU/mL (10× IAV) to demonstrate that viral concentration did not affect the rate of viral decay. Data points indicate the mean ± SD of triplicate measurements at each time point, presented as log10 of the remaining concentration (C) at each time point relative to the initial concentration (C0 ). Data are compiled from three independent experiments, and data points where C was below the limit of detection for each plaque assay are indicated by open symbols. Dotted line indicates no decay. (C) Immunofluorescence images of A549 cells infected with IAV samples treated at pH 4 or 7 for 10 or 30 s. All samples were neutralized prior to cell infections. A549 cells were infected at a multiplicity of infection (MOI) of 2, and IAV protein production was visualized by immunofluorescent staining of nucleoprotein at 3 h post-infection. Scale bar corresponds to 75 µm. Images are representative of duplicate experiments. (D) VSV particles encoding Renilla Luciferase were pseudotyped with HA and NA of the A/WSN/33 virus (VSV-H1N1), for comparison to VSV expressing the wild-type surface protein G (VSV-G). Both VSV stocks were acidified to pH 4, and samples were neutralized after 10 s or 30 s of pH exposure. Control samples of each VSV strain were held at pH 7. Entry capacity of treated VSV samples was then determined by measuring the luciferase activity 7 h post-infection in MDCK cells. Data were derived from three independent experiments, with samples quantified in duplicate. Data are presented as log10 of relative light units (RLU) at each time point relative to RLU of non-treated samples (RLU0). Dotted line indicates no decay. (E) IAV particles were pH-treated and neutralized as in C, then stained with an HA-specific antibody recognizing the post-fusion HA conformation (purple). Staining with an NP-specific antibody (blue) served as a control to ensure the same amount of viral material was deposited between samples. Scale bar corresponds to 250 µm. Images are representative of duplicate experiments.

