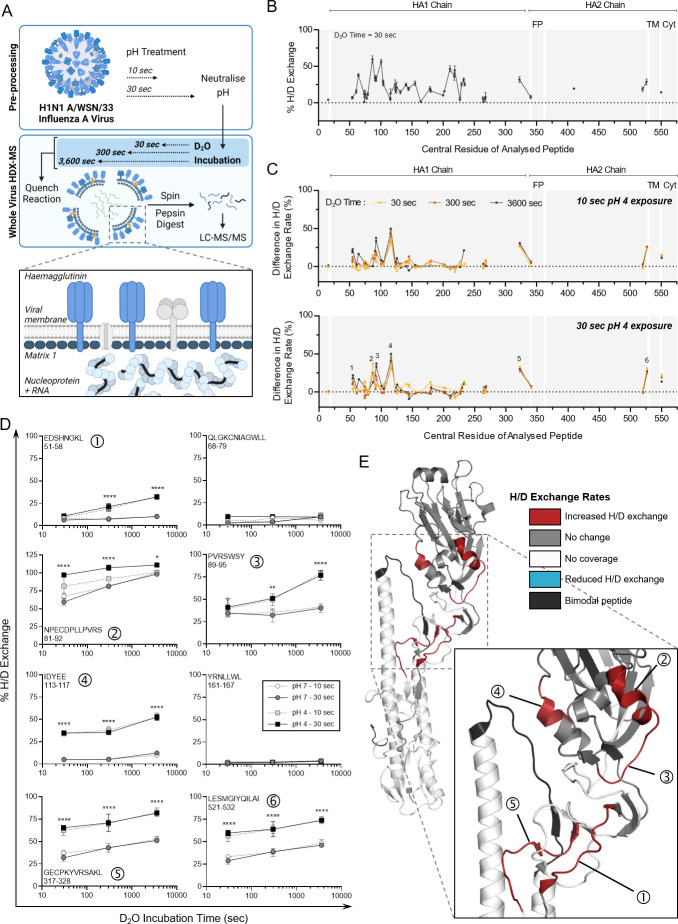
Fig 2.
HDX-MS characterization of HA protein from the whole IAV after transient exposure to acidic conditions. (A) Schematic of the whole-virus HDX-MS process. In bulk solution, the whole virus is held at neutral pH or is acidified at pH 4 for 10 or 30 s prior to neutralizing back to pH 7. Neutralized whole-virus samples are incubated in D2O buffer for 30, 300, or 3,600 s, then quenched, prior to pepsin digestion and LC-MS analysis. Organization of viral proteins within the intact influenza A virion is highlighted by the inset, with the external haemagglutinin and the internal proteins matrix 1 (M1) and nucleoprotein colored blue for visibility. (B) Hydrogen/deuterium (H/D) exchange percentages measured for HA protein from whole IAV samples held at neutral conditions (pH 7) for 30 s. Samples were then incubated in D2O for 30 s, quenched, and digested prior to HDX-MS analysis. Data points indicate the mean percentage of H/D exchange ± SD for triplicate samples. Peptides are organized linearly according to the position of the central amino acid of each individual peptide along the published sequence for HA (Uniprot: P03452). Continuous lines indicate regions of continuous peptide coverage by MS. Peptides showing bimodal activity are excluded from the graph. Protein domains of interest are indicated by gray shading and white lines: FP, fusion peptide; TM, transmembrane domain; and Cyt, cytoplasmic region. (C) Residual plots showing the difference in H/D exchange percentages induced by exposure to pH 4 for 10 s or 30 s, when compared to corresponding pH 7 control samples. Individual data points indicate the mean percentage of H/D exchange difference for triplicate samples. Dotted line indicates no difference in H/D exchange. Peptides of interest showing increased H/D exchange are numbered 1–6. (D) Uptake plots for selected Peptides 1–6 showing increased H/D exchange after pH 4 exposure. Data show the total percentage of H/D exchange for pH 7 or 4 samples after D2O incubation for 30, 300, or 3,600 s. The sequence and residue positions of each peptide are indicated in each panel. Data points indicate the mean percentage of H/D exchange ± SD for triplicate samples. Data analyzed by two-way ANOVA (**P < 0.01, ***P < 0.001, and ****P < 0.0001, when comparing 30 s pH-exposed samples for each D2O time point. Statistical results for the comparison of 10 s pH-exposed samples appear in Table S1). (E) Protein regions showing increased (red) or decreased (blue) H/D exchange rates or showing no change in H/D exchange rates (gray) after 30 s at pH 4 (compared to pH 7 control) mapped onto the crystal structure of A/PR8 HA (PDB: 1RU7). White indicates regions of no peptide coverage, and peptides with bimodal activity are colored black. HA monomer is shown, with an inset showing the specific location of Peptides 1–5, corresponding to those in panel D. Peptide 6 (521–532) from panel D is not indicated as the crystal structure is truncated prior to these residues.

