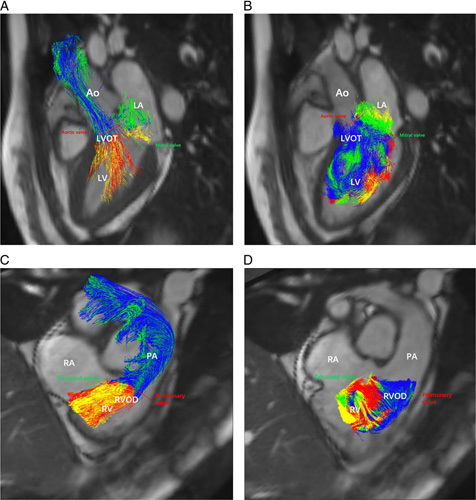
FIGURE 4.

Visualization of left and RV flow in a male patient with chronic thromboembolism (MPAP = 16 mm Hg, PVR = 160 dyne.s.cm5). A, Pathline visualization of the LV flow components (DF, RI, DE flow, and residual volume) in systole, B, Pathline visualization of the LV flow components (DF, RI, DE flow, and residual volume) in diastole. C, Pathline visualization of the RV flow components (DF, RI, DE flow, and residual volume) in systole. D, Pathline visualization of the RV flow components (DF, RI, DE flow, and residual volume) in diastole. Ao indicates aorta; LA, left atrium; LVOT, left ventricular outflow tract; PA, pulmonary artery; RA, right atrium; RVOD, RV outflow tract.
