Fig 2.
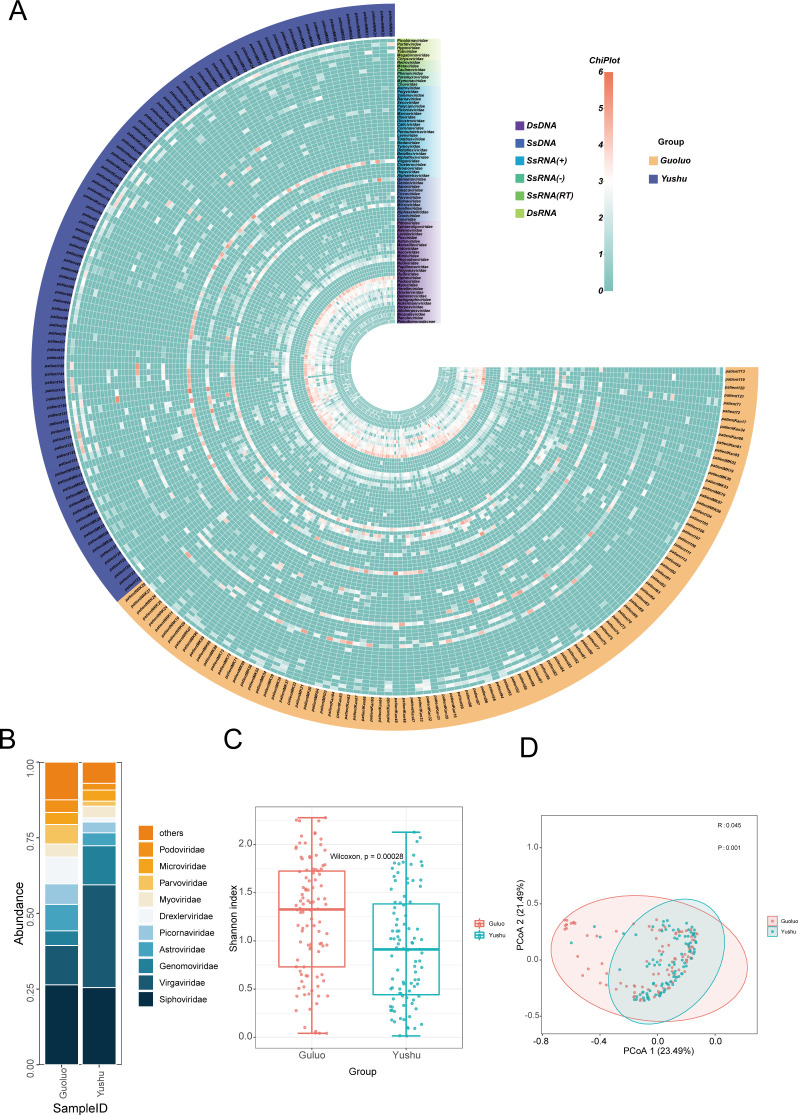
Statistical analysis of enterovirus communities. (A) Heatmap was constructed after transforming read counts per virus family in individual libraries on a log10 scale. Nucleic acid types, virus families, and sampling region groupings are annotated with different colors (see color legend). (B) Bar chart by virus database by geography showing the relative proportion and taxonomy based on viral families. (C) Viruses to be compared were normalized using Megan prior to the comparison of virus alpha diversity, and the virus abundance (family level) of the Guoluo Group and Yushu group, which were divided into different sampling regions, was measured using the Shannon index. The P value was calculated using the Wilcoxon test. (D) Viruses to be compared were normalized using Megan prior to the comparison of virus beta diversity, principal co-ordinates analysis (PCoA) analysis of Guoluo Group and Yushu Group at the family level. R was more than 0, which indicated that there were differences between the groups. Studies were considered statistically significant when the P value was less than 0.05.

