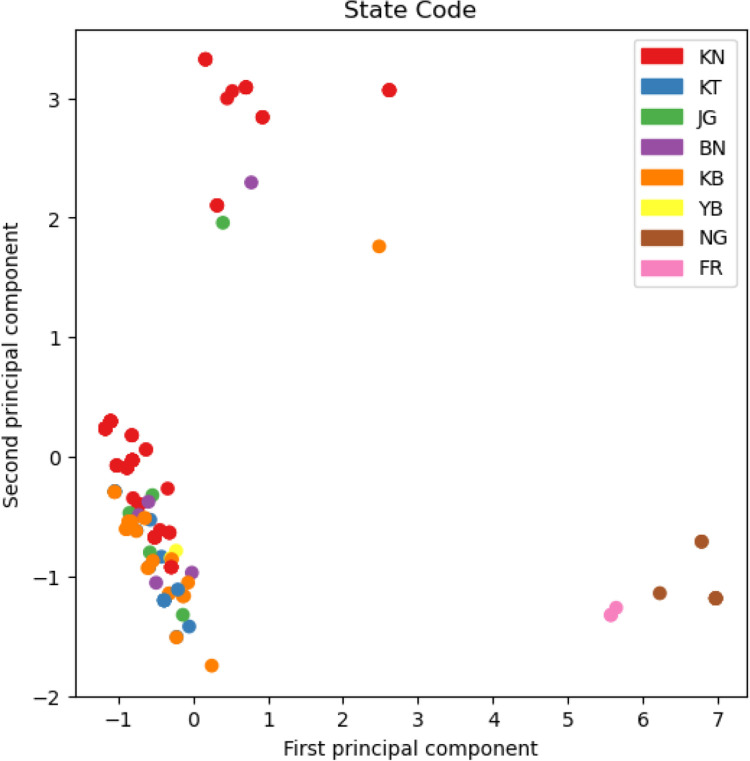
Fig 2. Principal component analysis of drug susceptibility.
Colors are related to states, BN = Borno, KB = Kebbi, KN = Kano, YB = Yobe, JG = Jigawa, KT = Katsina, NG and FR refer to Nigeria and France samples respectively without more information (see also S1 Material).

