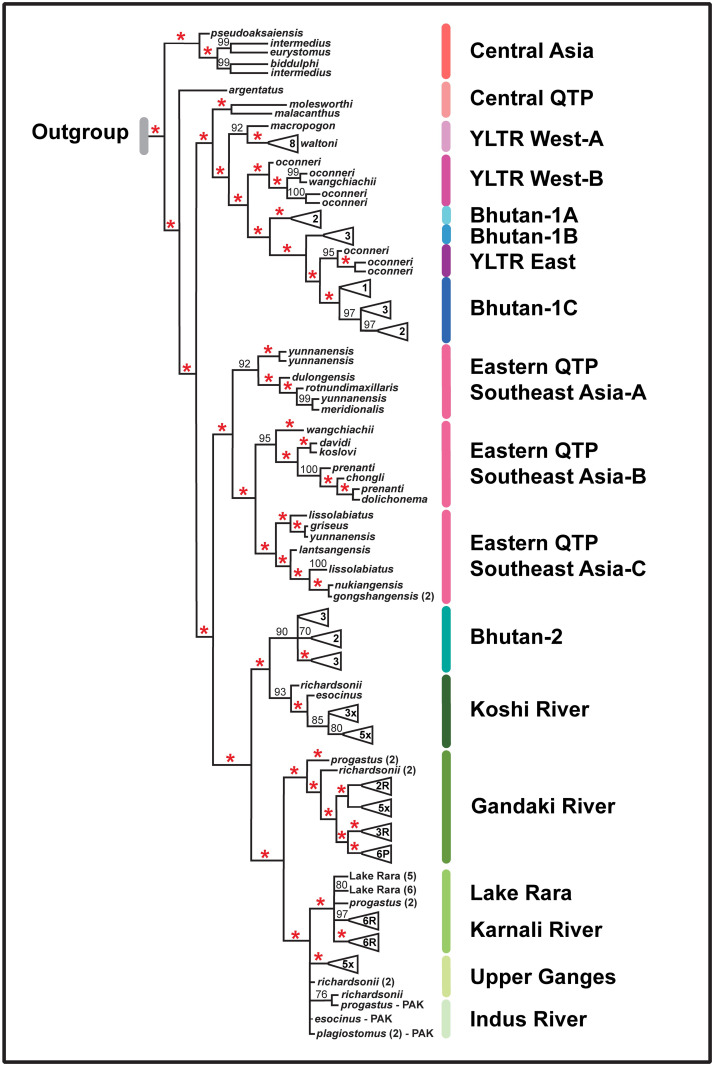
Fig 4. Maximum likelihood (ML) tree reflecting phylogenetic relationships among biogeographic samples.
The constituent samples representing each biogeographic clade are provided in S3 Table under ’Species Name,’ ’Haplotype,’ ’Accession #,’ ’Location,’ and ’Group’ headings.’ Data were derived from sequence analysis of the cytochrome-b mitochondrial gene (1,140 bp, 140 distinct haplotypes). Red asterisk = SH-aLRT (Shimodaira-Hasegawa approximate likelihood ratio test) ≥ 80% and UFboot (ultrafast bootstrap approximations) ≥ 95% (IQ-Tree v.2 Manual: http://www.iqtree.org). Numbers only at specific nodes represent UFboot values. Letters within composite species-triangles at tips of the tree represent species, with R = S. richardsonii, P = S. progastus, and x = Both species, with numbers representing individuals contained.

