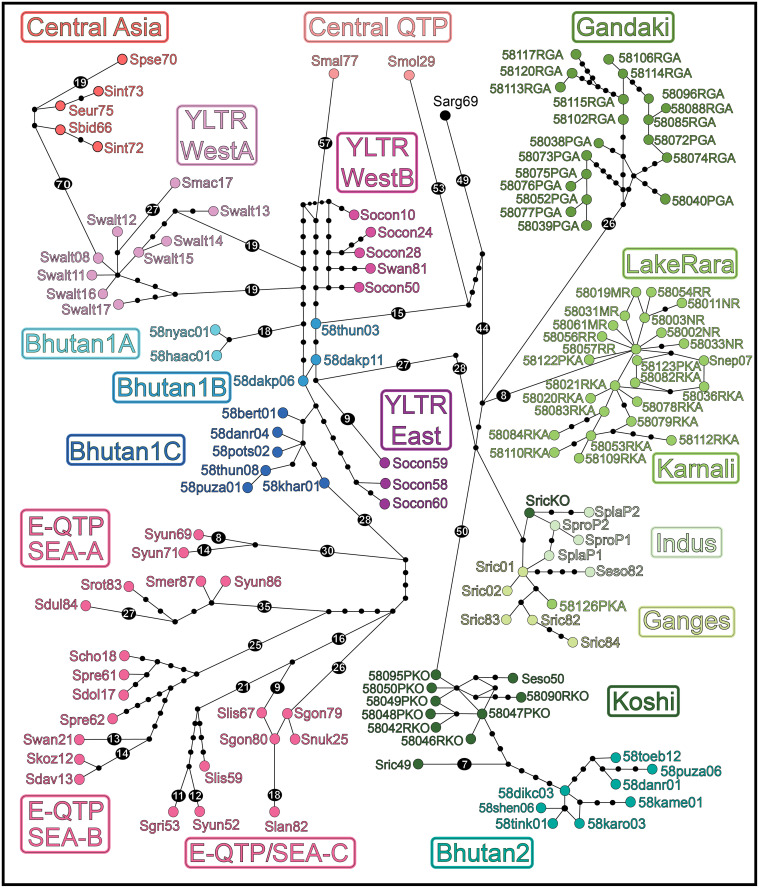
Fig 5. TCS haplotype network reflecting stepwise mutational differences between samples and among geographic groups.
The contents of each biogeographic clade are provided in S3 Table under ’Species Name,’ ’Haplotype,’ ’Accession #,’ ’Location,’ and ’Group’ headings. Data were derived from sequence analysis of the cytochrome-b mitochondrial gene (1,140 bp, 132 haplotypes). Geographic groupings (Fig 3, S3 Table) are labeled within rectangles, with group colors identical to those in Figs 3 and 4. Black circles represent hypothetical haplotypes to reflect stepwise mutations >14. See S1 Appendix for the associations between divergence intervals for clades and geomorphic/ climatic drivers in the Himalaya.

