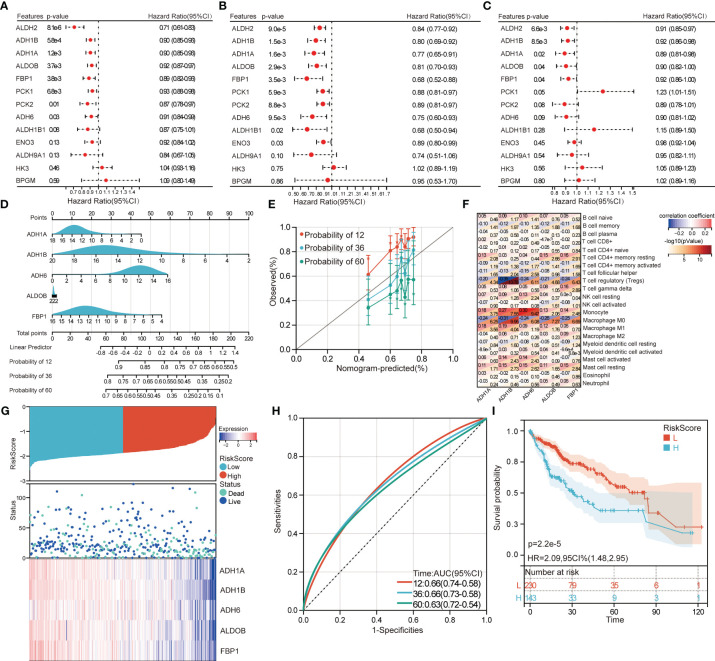
Figure 7.
Identification of prognostic genes and construction of molecular subtypes. Univariate Cox regression analyzed prognostic role of candidate genes for HCC patients in TCGA (A), GSE14520 (B), and GSE141198 (C). (D) Nomograms for predicting overall survival in patients with HCC. (E) Calibration curves for predicting overall survival of the nomogram. (F) Correlations between immune cells and prognostic genes. Red represents positive correlation and blue represents negative correlation. (G) The HCC patients in TCGA were divided into high- and low-risk groups according to the median risk score. (H) ROC curves of median risk score for 12-, 36- and 60-month OS of HCC patients. AUC, area under the ROC curve. (I) Kaplan–Meier survival curves of high- and low-risk groups. H, high-risk group; L, low-risk group. HR, hazard ratio; CI, confidence interval.

