
Figure 7. Death-seq identifies modifiers of cell death in the absence of drugs as well as in nonapoptotic cell death.
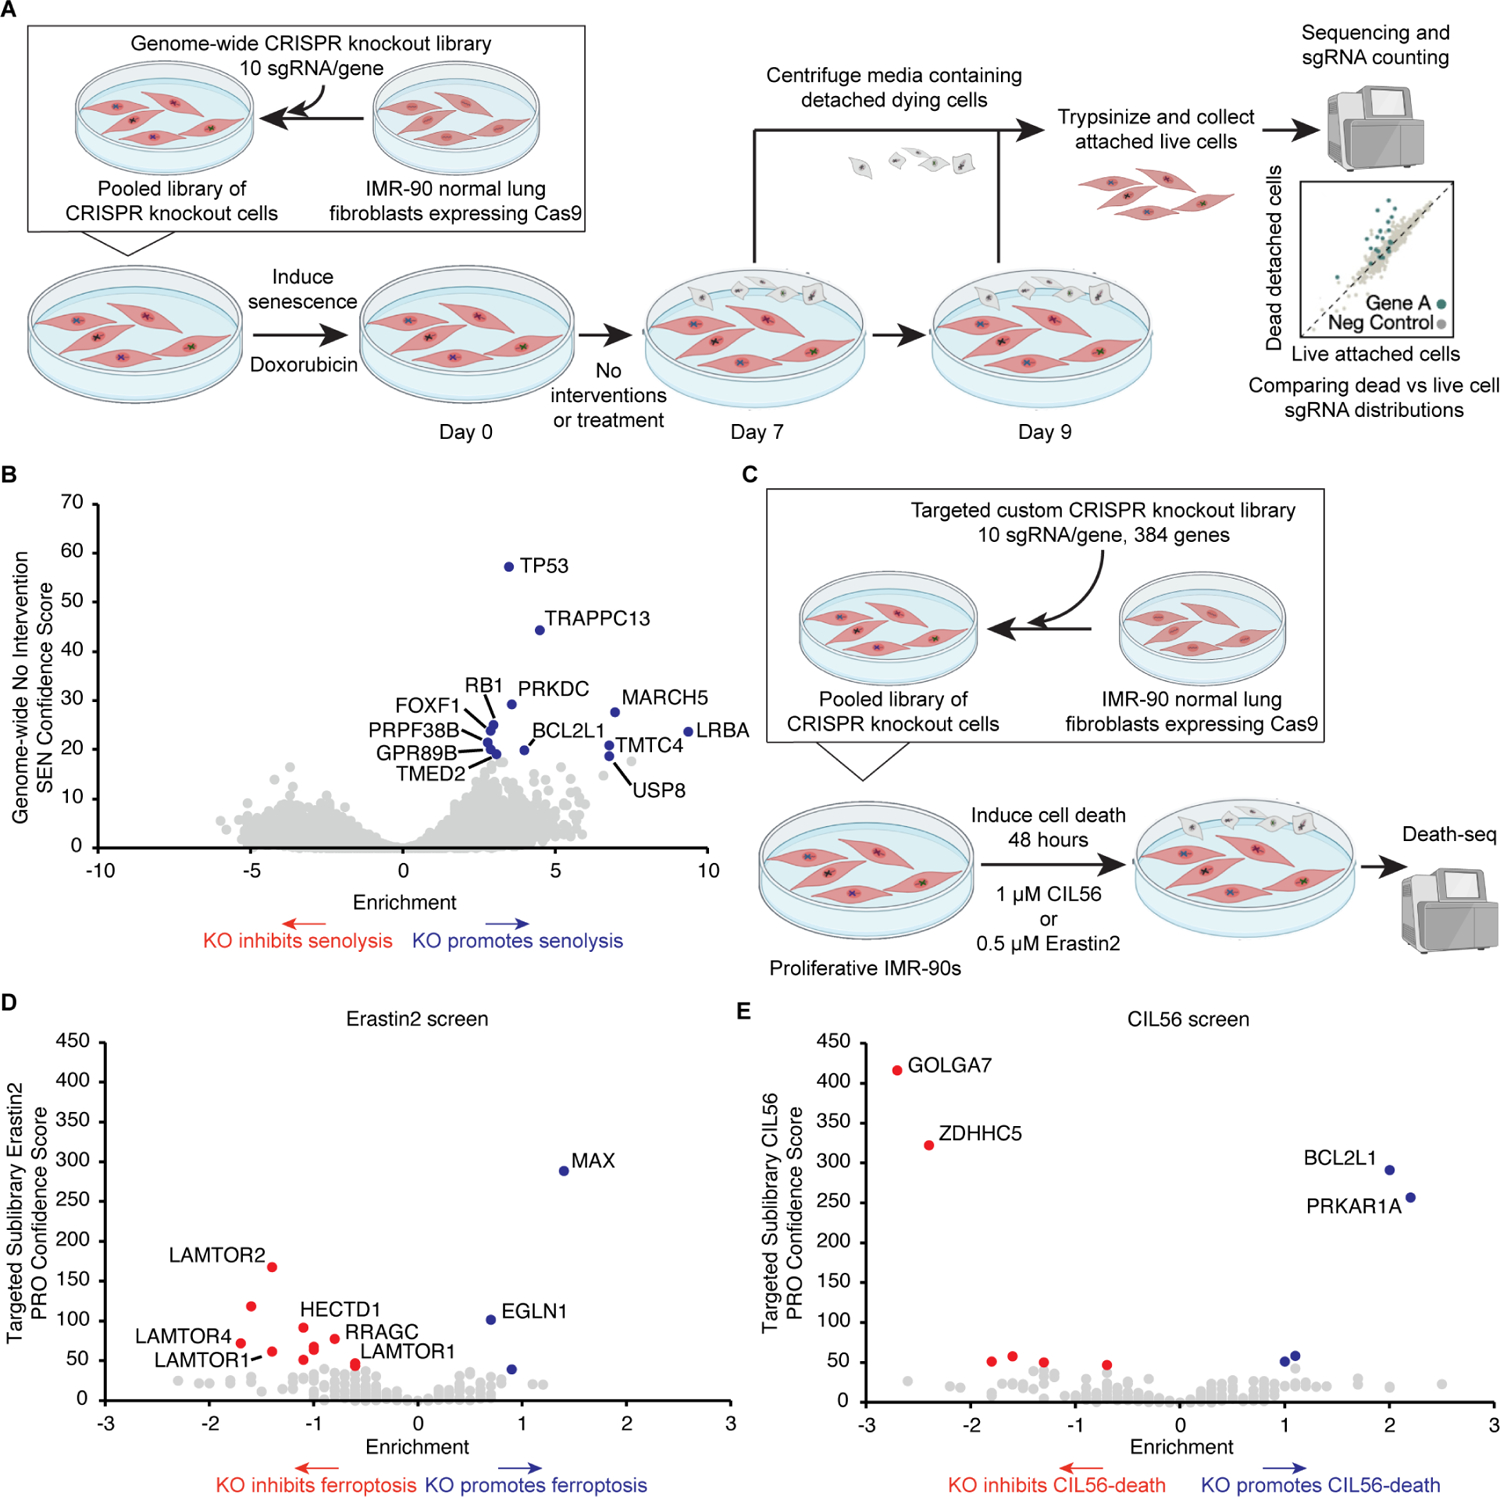
(A) Schematic of Death-seq genome-wide CRISPR KO screen for modifiers of Doxo-SEN cell death in the absence of small molecules or perturbation. The screen was performed in duplicate.
(B) Volcano plot of the effects and confidence scores of all the genes in the genome-wide CRISPR screen in the absence of small molecules. Effects and casTLE scores are calculated by casTLE. Labelled are the 13 genes passing 30% FDR for promoting (blue) senescent cell death when knocked out.
(C) Schematic of Death-seq sublibrary CRISPR KO screens in proliferative IMR-90s for modifiers of ferroptosis induced by treatment with 0.5 μM erastin2 for 48 h and cell death induced by treatment with 1 μM CIL56 for 48 h. The screens were performed in duplicate.
(D) Volcano plots of the effects and confidence scores of all the genes in the sublibrary CRISPR screens for modifiers of erastin2-induced ferroptosis (left) and CIL56-induced cell death (right) in proliferative IMR-90s. Effects and casTLE scores are calculated by casTLE. Labelled are the genes passing 30% FDR for inhibiting (red) or promoting (blue) cell death when knocked out. See also the results and raw sequencing counts from screens in Tables S1 and S2 respectively.