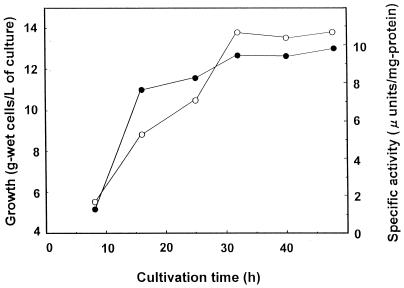
FIG. 3.
Time course of VM1 reductase activity in the mycelia of S. virginiae. At the indicated time, a 500-ml culture was harvested. After sonication to disrupt cells, VM1 reductase activity in the crude cell extract was measured as described in Materials and Methods. Growth (•) is expressed as grams (wet weight) of cells per liter of culture. VM1 reductase activity (○) is expressed as microunits per milligram of protein.

