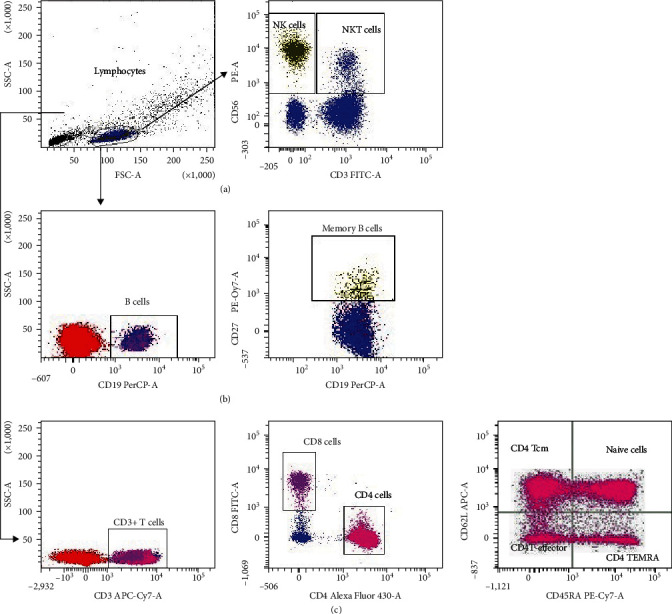
Figure 1.

Gating strategy to distinguish different lymphocyte populations by flowcytometry. PBMCs from the study participants were stained with panels of fluorochrome-labeled antibodies to assess the frequency and immune profile. The numbers in the histogram are the mean of the cell population representing for the study group. (a) Lymphocytes and NK cells (CD3−CD56+), NKT-like (CD3+CD56+) cells profile; (b) B(CD19+) cells and memory B (CD19+CD27+) cells profile; (c) T-helper (CD3+CD4+), T-cytotoxic (CD3+CD8+) cells profile, memory Th and Tc cells, CD4+naïve T cells, CD4+T central memory cells effector cells, TEMRA cells.
