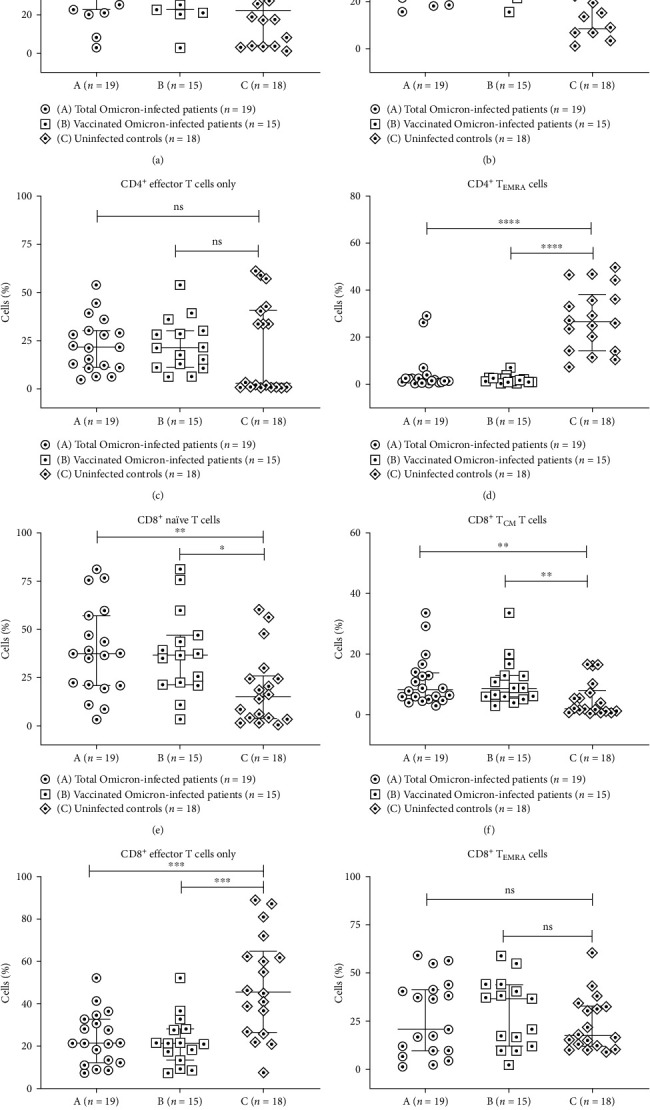
Figure 3.

Flow cytometry analysis of T and memory T-cell subsets in Omicron-infected patients and uninfected controls. PBMCs from (A) total Omicron-infected patients (n = 19); (B) vaccinated Omicron-infected patients (n = 15); (C) uninfected controls (n = 18) were stained and acquired on flow cytometer. Vertical scatter plots denote the comparisons of frequencies of immune cells and their subpopulation among different study groups: (a–d) CD4+ memory T-cell subsets (e–h) CD8+ memory T-cell subsets, namely naive, central, TEMRA and effector memory. Data are presented as percentage of immune cells out of lymphocytes. The dots represent individual values and bars represent mean + SD values ( ∗p-value < 0.05, ∗ ∗p-value < 0.005, and ∗ ∗ ∗p-value < 0.0001).
