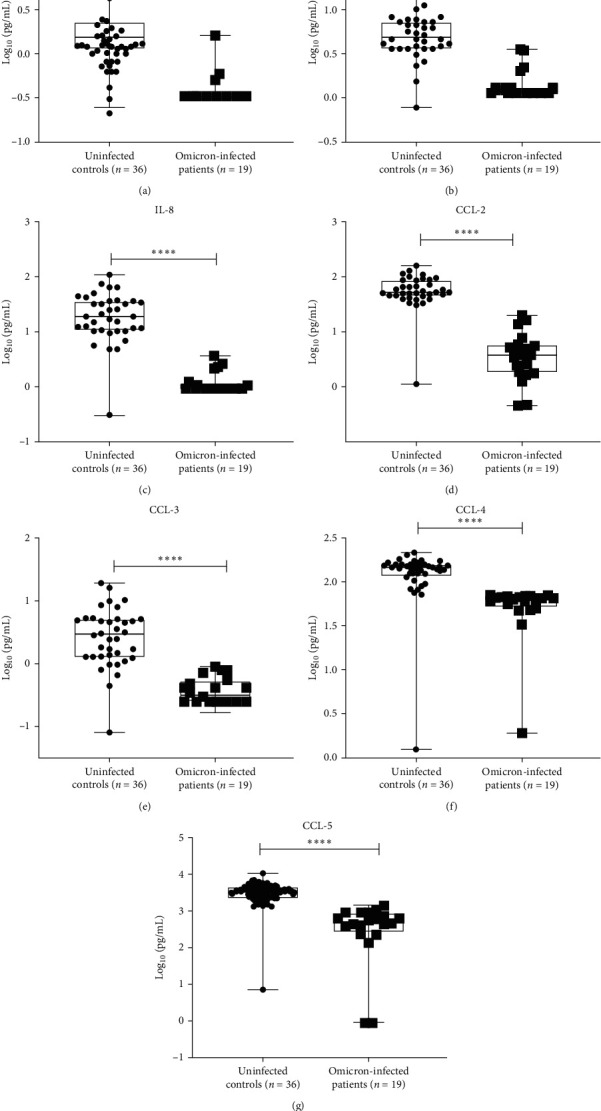
Figure 5.

Concentrations of cytokines and chemokines expressed in log10 (pg/mL) in Omicron-infected patients and uninfected controls. Comparison of concentrations of cytokines and chemokines expressed in log10 (pg/mL) in Omicron-infected patients and uninfected controls. (a) IL-6, (b) IFN-γ, (c) IL-8, (d) CCL-2, (e) CCL-3, (f), CCL-4, (g) CCL-5; ∗p-value < 0.05, ∗ ∗p-value < 0.005, and ∗ ∗ ∗p-value < 0.0001).
