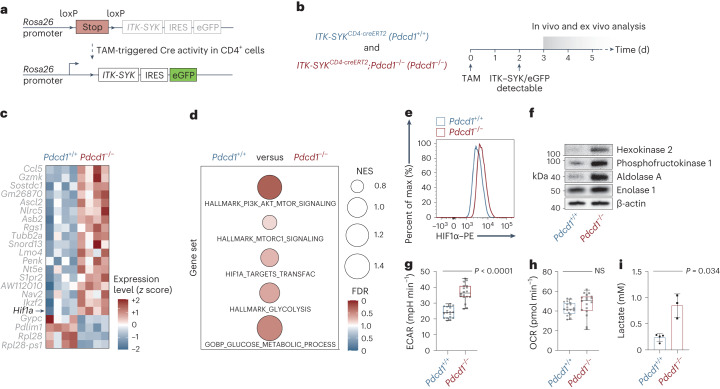
Fig. 1. Loss of Pdcd1 enables oncogene-enforced glycolysis in T cells.
a, Transgenic ITK-SYK allele with eGFP reporter sequence and Cre-induced excision of the stop cassette. IRES, internal ribosome entry site; TAM, tamoxifen. b, Experimental strategy to explore early molecular events upon ITK–SYK induction in the presence or absence of Pdcd1. c, Top 20 differentially expressed genes between ITK-SYKCD4-CreERT2 (‘Pdcd1+/+’)- and ITK-SYKCD4-CreERT2;Pdcd1−/− (‘Pdcd1−/−’)-derived ITK–SYK-expressing T cells. RNA-seq was performed using spleen-derived eGFP+ T cells, sorted by flow cytometry on day 5 after tamoxifen injection (n = 4 mice per group). Expression values are normalized z scores. d, GSEA of the indicated signatures. FDR, color intensity of circles; NES, circle diameter. Blue and red indicate the group in which the signature was positively enriched; NES, normalized enrichment score; FDR, false discovery rate. e, Flow cytometry for HIF1α in ITK–SYK-expressing T cells. Spleen-derived single-cell suspensions were generated from ITK-SYKCD4-CreERT2 and ITK-SYKCD4-CreERT2;Pdcd1−/− mice on day 5 after tamoxifen injection. Max, maximum. f, Western blot analysis from lysates of ITK–SYK-expressing eGFP+ T cells, sorted by flow cytometry from ITK-SYKCD4-CreERT2 and ITK-SYKCD4-CreERT2;Pdcd1−/− mice on day 5 after tamoxifen injection. g, ECAR metabolic flux analysis of ITK–SYK-expressing CD4+ T cells isolated from ITK-SYKCD4-CreERT2 and ITK-SYKCD4-CreERT2;Pdcd1−/− mice on day 5 after tamoxifen injection (n = 3 biological replicates per group). Data were normalized using total cellular protein. P, two-sided Student’s t-test. Middle line denotes the median, the top and bottom box edges denote 0.25 and 0.75 quantiles, respectively, and the whiskers denote the minimum and maximum values. h, OCR metabolic flux analysis from the same experiment as in g. P, two-sided Student’s t-test. i, Lactate concentration in cell culture supernatants. ITK–SYK-expressing eGFP+ cells were sorted by flow cytometry from ITK-SYKCD4-CreERT2 and ITK-SYKCD4-CreERT2;Pdcd1−/− mice on day 5 after tamoxifen injection and incubated overnight in vitro (n = 3 and n = 4 biological replicates per group). Data were normalized using viable cell numbers. P, two-sided Student’s t-test. Shown are the mean ± s.d. and individual data points. c,d, Data from one experiment. e,f, Representative data from two independent experiments with two biological replicates per group. g,h, Representative data from two independent experiments with three biological replicates per group. i, Representative data from two independent experiments.

