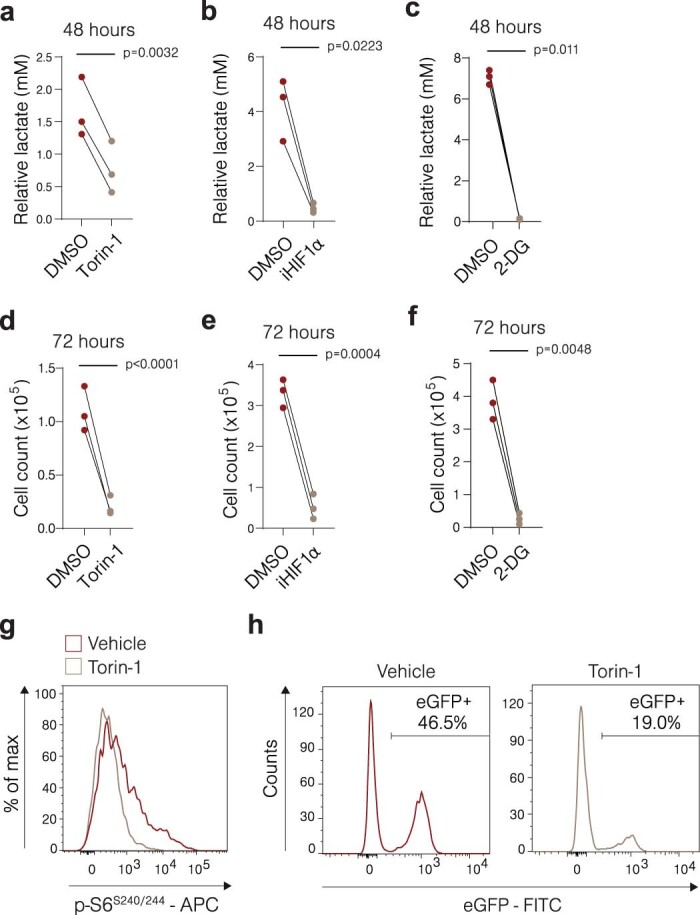
Extended Data Fig. 3. Transformed T cells with Pdcd1 deletion depend on the mTOR-HIF1α-glycolysis cascade.

a,b,c, Lactate concentrations in the cell culture supernatants of eGFP+ FACS sorted cells derived from the spleens of acutely induced ITK-SYKCD4-creERT2;Pdcd1−/− mice and incubated in vitro for 48 h in the presence of the mTOR inhibitor Torin-1 (a; 0.1 μM), HIF1α inhibitor PX-478 (b; iHIF1α, 5 μM) or glycolysis inhibitor 2-DG (c; 1 mM) or DMSO as a control (n = 3 biological replicates). Lactate concentrations were normalized to the viable cell numbers. P=paired two-sided Student’s t-test. d,e,f, Number of viable ITK-SYK+PD-1- cells cultured in vitro for 72 h with the mTOR inhibitor Torin-1 (d; 0.1 μM), HIF1α inhibitor PX-478 (e; iHIF1α, 5 μM) or glycolysis inhibitor 2-DG (f; 1 mM) or DMSO as a control (n = 3 biological replicates). eGFP+ T cells were sorted by FACS from acutely induced ITK-SYKCD4-creERT2;Pdcd1−/− animals (n = 3 biological replicates). P=paired two-sided Student’s t-test. g, Phosflow analysis of serine 240/244 of S6 ribosomal protein in ITK-SYK+PD-1- cells isolated from NSG mice treated with Torin-1 or vehicle. Cells were fixed and permeabilized immediately after isolation. h, eGFP percentage of viable lymphocytes in the peripheral blood of Torin-1 or vehicle-treated NSG mice, which were transplanted with 1,000 eGFP+ FACS-sorted ITK-SYK+PD-1- cells isolated from acutely induced ITK-SYKCD4-creERT2;Pdcd1−/− mice. Blood was taken seven days after initiation of treatment. a,b,c,d,e,f, Representative results from 2 independent experiments with three biological replicates per group. g, Representative results from two out of the six animals analyzed. h, Representative results from two out of the thirteen animals analyzed.
