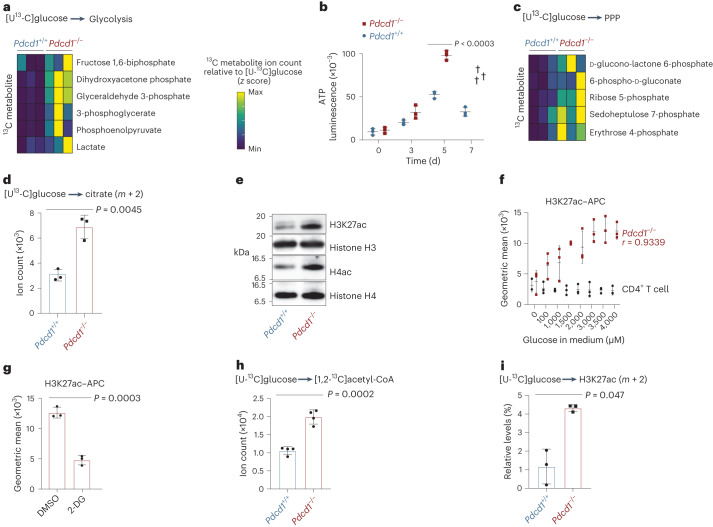
Fig. 3. PD-1 facilitates glycolysis-dependent histone acetylation.
a, Intracellular 13C abundance within the glycolysis pathways detected by targeted LC–MS/MS relative to intracellular [U-13C]glucose in ITK–SYK+ T cells with or without PD-1, cultured with uniformly labeled [U-13C]glucose for 3 h in vitro. Data are normalized to viable cell number and z scores per metabolite. Min, minimum. b, Time-dependent ATP measurement in ITK–SYK+ T cells with or without PD-1. P, two-sided Student’s t-test. Data are presented as the mean ± s.e.m. and individual data points for each animal. The cross indicates death of the animal. c, Ion count for intracellular 13C-labeled metabolites in the pentose phosphate pathway (PPP). d, Ion count for intracellular 13C-citrate (m + 2) isotopomers. P, two-sided Student’s t-test. Shown are the mean ± s.d. and individual data points. e, Western blot analysis of acetylated histones in ITK–SYK+ T cells with or without PD-1. H4ac, H4 acetylation. f, Flow cytometry for H3K27ac in wild-type CD4+ or ITK–SYK+ T cells after a 4-h in vitro incubation with different glucose concentrations. r, Pearson’s correlation coefficient. Data are presented as mean ± s.d. and individual data points. g, Flow cytometry for H3K27ac in ITK–SYK+PD-1− cells after a 4-h in vitro culture with 2-DG (1 mM) or DMSO. P, paired two-sided Student’s t-test. Data are presented as mean ± s.d. h, Levels of [U-13C]glucose-derived intracellular [1,2-13C]acetyl-CoA determined by targeted LC–MS/MS in ITK–SYK+ T cells with or without PD-1 cultured with uniformly labeled [U-13C]glucose (11 mM) for 4 h in vitro (n = 4 mice per genotype). Data were normalized as in a. P, two-sided Student’s t-test. Data are presented as mean ± s.e.m. i, Levels of [U-13C]glucose-derived 13C-H3K27ac (m + 2) determined by orbitrap LC–MS/MS. Experiment as in h (with n = 3 mice per genotype). Data were normalized as in a. P, two-sided Student’s t-test. Data are presented as mean ± s.d. a–d, Representative data from two independent experiments with n = 3 biological replicates per group. e, Representative data from two independent experiments with two biological replicates per group. f, Representative data from two independent experiments. g, Representative data from two independent experiments with three biological replicates per group. h, Representative data from one experiment with four biological replicates per group. i, Representative data from one experiment with three biological replicates per group.

