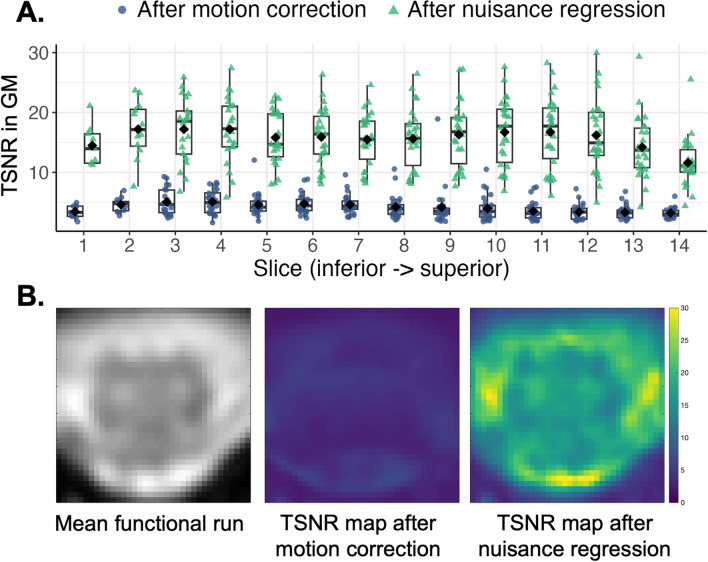
Figure 2.
Temporal signal-to-noise ratio (TSNR). (A) Average gray matter (GM) TSNR by participant and slice after different processing steps for n = 26 participants. Boxplots show median and inter-quartile ranges, diamonds show group means. Note there are fewer data points for slices 1–3 as GM disappears in the lower cord below the conus medullaris. (B) TSNR maps for one example participant (43-year-old female) in one central slice.

