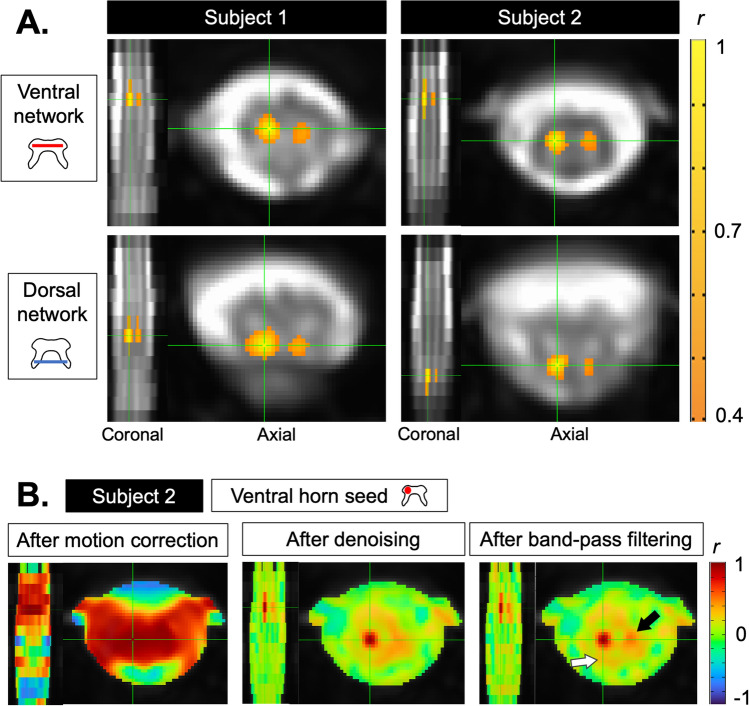
Figure 3.
(A) Seed-based correlations in two participants (Subject 1: 27-year-old male, Subject 2: 32-year-old female) with AFNI-InstaCorr, thresholded at r = 0.4 (positive correlations only), uncorrected and un-clusterized, using a whole-cord (gray and white matter) mask on fully pre-processed data. Green crosshairs indicate each seed voxel. Slice locations are shown in the coronal plane to the left of each axial image. Top: positive correlations between a seed voxel in the left ventral horn and the contralateral horn, and the left ventral horn on adjacent slices. Bottom: positive correlations between a seed in the left dorsal horn and the contralateral dorsal horn, and the left dorsal horn in adjacent slices. (B) The same data as in the top right panel of A (Subject 2, ventral network) are shown at different stages of pre-processing, using a mask of the spinal canal (cord and cerebrospinal fluid (CSF)). Positive (yellow/red) and negative (blue) correlations are shown. Starting with a seed voxel in the left ventral horn, areas of high correlation are present across the cord within-slice and across several slices. After denoising, voxelwise correlations in the CSF revert towards zero (in green). After band-pass filtering, the contralateral ventral horn appears with further spatial precision (red region, black arrow). Moderate correlation can be seen in the ipsilateral dorsal horn (in orange, white arrow) that did not satisfy the threshold in the above top right panel. Similar maps for all networks and subjects at different stages of processing are shown in Supplemental Fig. S2.

