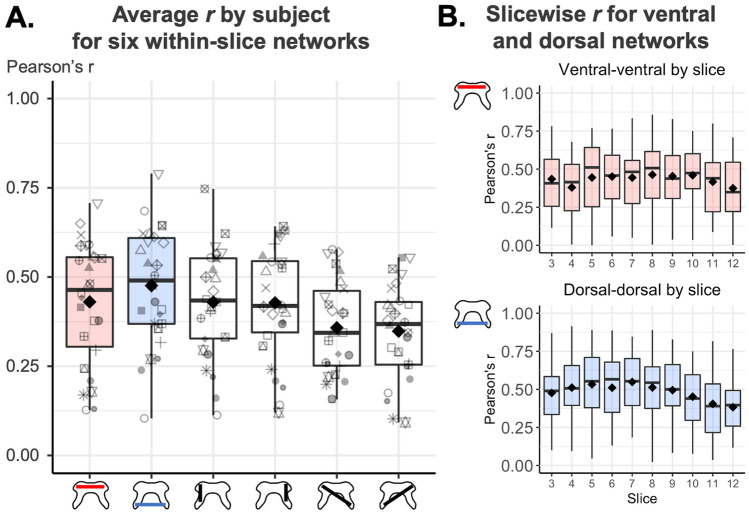
Figure 4.
Within-slice connectivity (Pearson’s r) between different region pairs. Boxplots show median and inter-quartile ranges, diamonds show group means. Outliers are defined as laying beyond 1.5 times the inter-quartile range of either the first or third quartile. (A) Average r by participant and network for the central 10 slices. Shapes represent different participants. Average correlations between gray matter regions are: between ventral horns: 0.43 ± 0.17, between dorsal horns: 0.48 ± 0.16, between left ipsilateral ventral-dorsal: 0.43 ± 0.15, between right ipsilateral ventral-dorsal: 0.43 ± 0.16, between contralateral left ventral and right dorsal: 0.35 ± 0.13, between contralateral right ventral and left dorsal: 0.36 ± 0.13. Although the range in subject-average connectivity values is quite large (e.g. ~ 0.10–0.70 for the ventral network), there are no outlier data points. (B) Ventral and dorsal networks connectivity for the central 10 slices.

