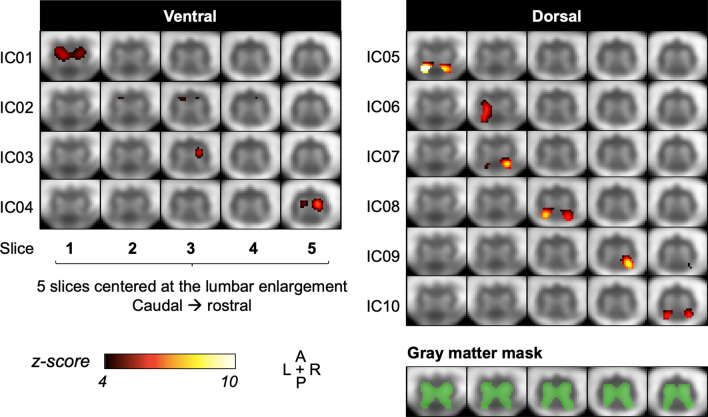
Figure 6.
Group spatial independent component analysis (ICA) with gray matter (GM) mask (in green) and a preset of 10 components (low dimensionality). Aggregate group component maps are shown, overlaid on the group-average functional image, with each row showing one independent component across five slices. All 10 obtained components are shown: four components in the ventral GM, and six in the dorsal GM. At the same lower threshold chosen for the high-dimensionality ICA (z ≥ 4), bilateral fluctuations are seen in a majority of components.

