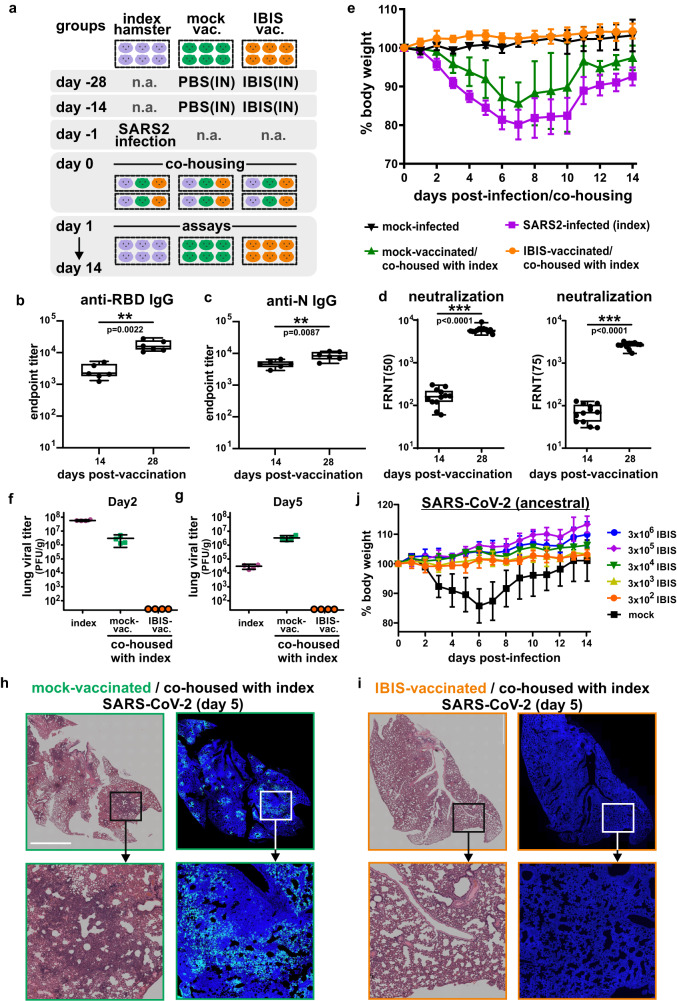
Fig. 4. IBIS vaccination impedes SARS-CoV-2 transmission in hamsters.
a Schematic diagram of hamster vaccination and viral challenge schedule. Six to ten week‑old female Golden Syrian hamsters were intranasally vaccinated with 2 doses of IBIS vaccine (3×10⁶ PFU) on day ‑28 and day −14, respectively (similar to Fig. 3a). On day −1, index hamsters (purple) were infected by intranasal inoculation of SARS-CoV-2 (ancestral) (1×10³ PFU). One day after infection (day 0), the index hamsters were co‑housed with PBS-vaccinated (green) and IBIS-vaccinated (orange) hamsters for 24 h, and then separated. Sera of vaccinated hamsters were harvested at 14 days after each dose of vaccination for the determination of RBD- or N‑specific IgG antibody titer (b, c); n = 6 per group. Neutralizing antibody titer of the sera was determined by FRNT50 and FRNT75 against authentic SARS‑CoV‑2 (ancestral) virus (d); n = 12 per group. Center line, median; box limits, upper and lower quartiles; whiskers, minima and maxima. Body weight of hamsters was monitored for 14 consecutive days post‑infection/co-housing and data are presented as mean ± SD (e); n = 6 per group. Lungs of index and co‑housed hamsters were harvested at day 2 and day 5 post‑infection/co‑housing for the determination of lung viral titer by plaque assay (f, g); n = 4 per group. Data are presented as mean ± SD. The lungs were also PFA‑fixed for histological examination by H&E staining (left panels) and IF staining for SARS‑CoV‑2 N (green) (right panels) at day 5 post‑infection/co‑housing. Nuclei were counterstained by Hoechst 33258 (blue) (h, i); n = 4 per group. White scale bar=0.5 cm. To determine the lower effective dose of IBIS, six to ten week‑old female hamsters were intranasally vaccinated with a single dose of serially tenfold diluted IBIS ranging from 3×10² PFU to 3×10⁶ PFU per hamster. At 14 days post-vaccination, the hamsters were intranasally challenged with 1×10³ PFU of SARS-CoV-2 (ancestral) virus. Body weight change was monitored for 14 days and data are presented as mean ± SD; n = 3 per group (j). Two-sided non-parametric Mann‑Whitney test was used to calculate statistical significance. ***, p < 0.001. Source data are provided as a Source Data file.

