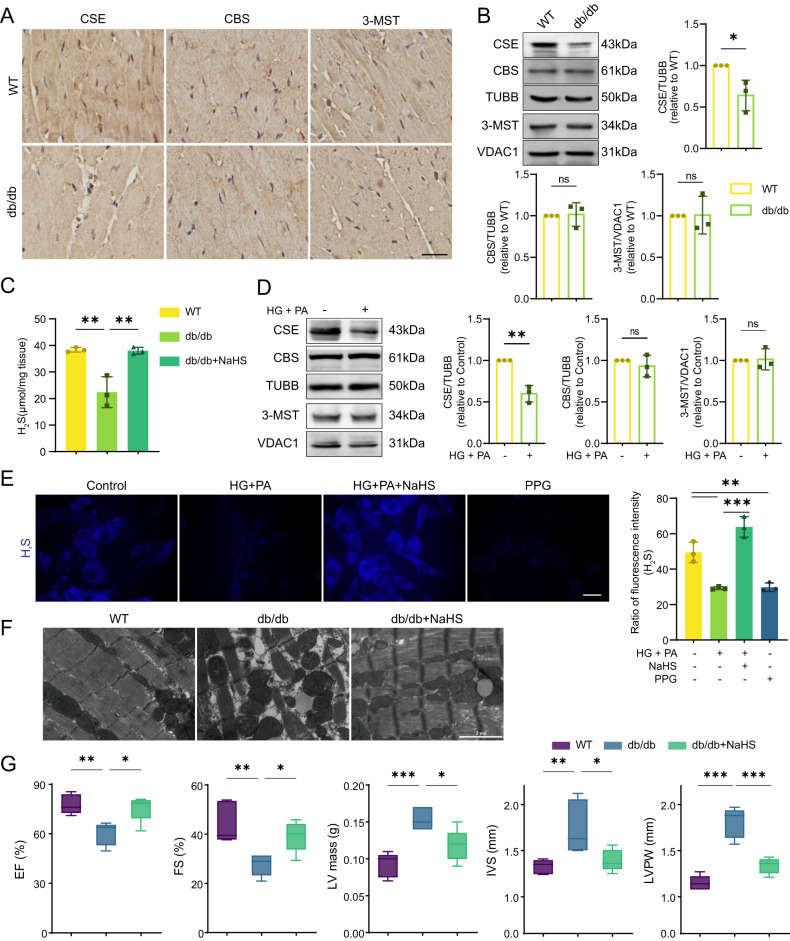
Fig. 1. Endogenous H2S level is decreased in type 2 diabetic models.
A Immunohistochemistry (IHC) staining of CSE, CBS and 3-MST in cardiac tissues. Scale bar: 25 μm. B Western blot (WB) showing the expression of CSE, CBS and 3-MST in cardiac tissues, n = 3. C H2S concentration in cardiac tissues, n = 3. D WB showing CSE, CBS and 3-MST levels in HL-1 cardiomyocytes, n = 3. E H2S content in HL-1 cardiomyocytes stained by fluorescence probe C-7Az, n = 3. Scale bar: 50 μm. F Transmission electron microscope (TEM) images of cardiac tissues. Scale bar: 2 μm. G Heart functions measured by heart echocardiography, n = 5. EF ejection fraction, FS fractional shortening, LV mass left ventricular mass, IVS interventricular septal, FVPW left ventricular end-diastolic posterior wall. All quantitative data are presented as mean ± SD from independent experiments. *P < 0.05, **P < 0.01, ***P < 0.001 by unpaired t test or ordinary one-way ANOVA.

