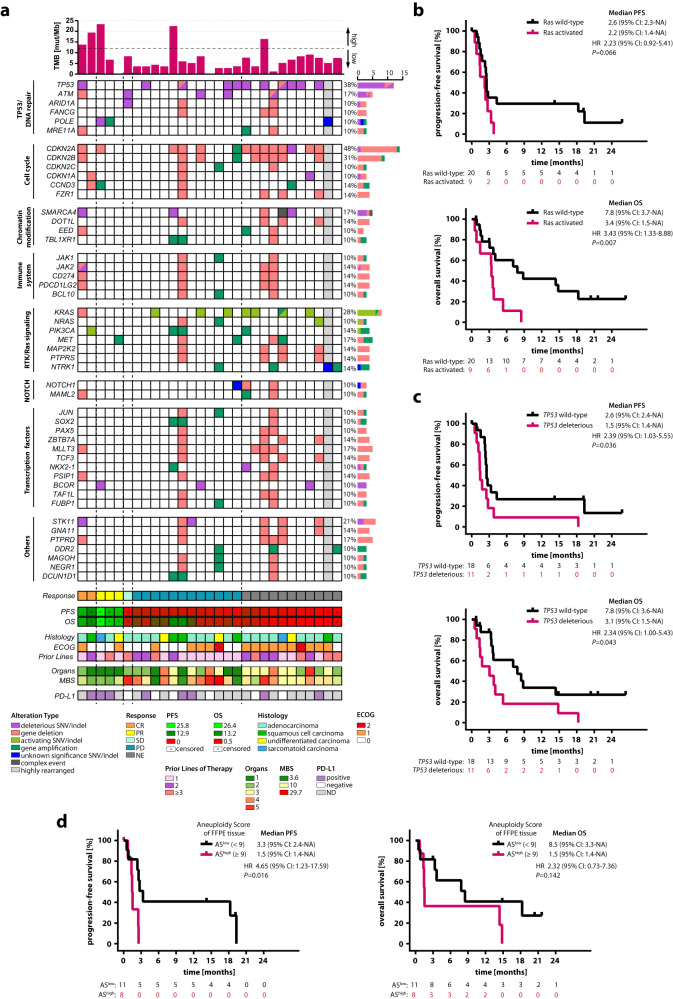
Fig. 3. Baseline genomic landscape of the CheCUP cohort revealed that patients with activated Ras signaling and/or functionally deleterious TP53 did not benefit from ICI treatment.
a Oncoplot showing potentially clinically relevant tumor gene alterations (SNVs/indels, gene deletions and amplifications) as assessed by comprehensive genomic profiling of baseline biopsy samples. Curated pathways and selected genes altered in 10% or more patients are shown. A column represents a patient and is grouped by the best response (indicated by vertical dashed lines) and related clinicopathologic features (n = 29); gray shaped columns indicate patients where an unambiguous CNA profile statement was impossible. Top bar chart represents tumor mutational burden (TMB). Percentages listed right represent the proportion of patients harboring an alteration in the gene listed left. Bottom bars show radiological response assessment, heatmaps of PFS and OS (both in months, censored patients marked with dots), CUP histology, ECOG status, number of therapy lines prior to ICI treatment, number of organs with metastases, heatmap of metastasis burden score (MBS), and PD-L1 expression status. b Kaplan-Meier estimates of PFS and OS, stratified according to activating RAS alterations: activated (n = 9) and wild-type (n = 20). c Kaplan-Meier estimates of PFS and OS, stratified according to functionally deleterious TP53 alterations: deleterious (n = 11) and wild-type (n = 18). d Kaplan-Meier estimates of PFS and OS, stratified according to low (n = 11) or high (n = 8) aneuploidy score (AS) of baseline FFPE tumor tissue, based on the median cohort AS value of 9. In (b-d), comparisons are made using a two-sided log-rank test, Cox proportional hazard regression modeling was used to calculate hazard ratio. 95% CI 95% confidence interval, HR hazard ratio, CR complete response, PR partial response, SD stable disease, PD progressive disease, FFPE formalin-fixed paraffin-embedded, AS aneuploidy score, NE not evaluable, ND not determined. Source data are provided as a Source Data file.

