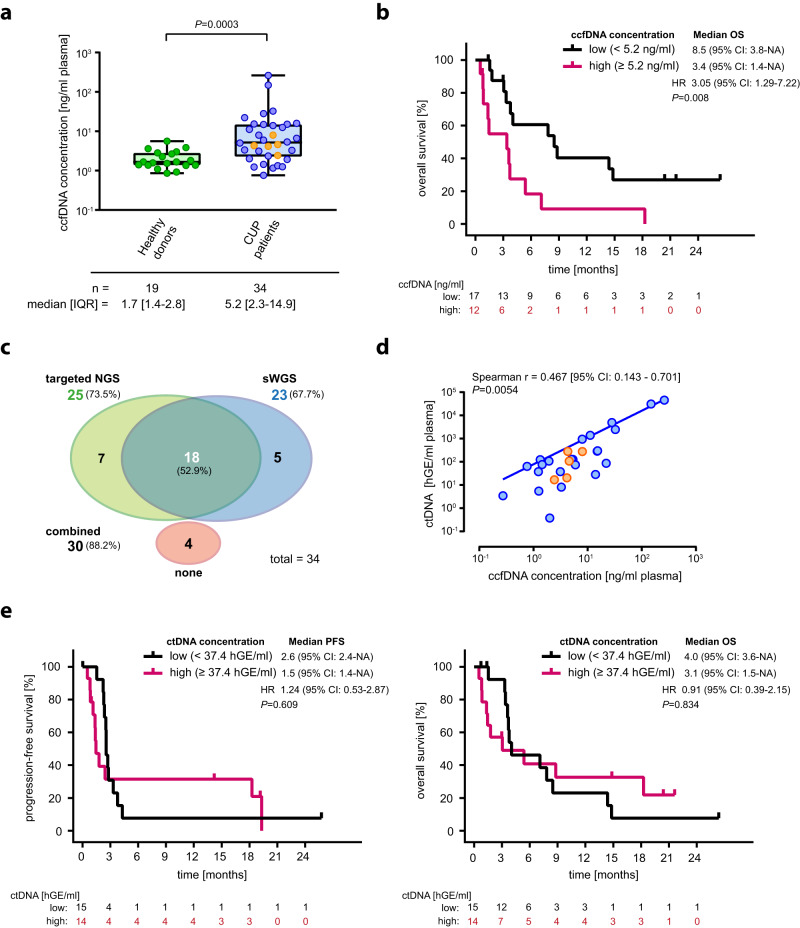
Fig. 4. Elevated baseline ccfDNA but not ctDNA is prognostic for inferior overall survival and ICI response in patients with recurrent/refractory unfavorable CUP.
a Baseline ccfDNA concentrations of healthy individuals (n = 19) and patients with recurrent or relapsed unfavorable CUP (n = 34). Each dot represents a single healthy individual or CUP patient, respectively; orange dots indicate CUP patients who radiologically respond to ICI treatment. The box contains the 25th to 75th percentiles of the dataset, a vertical line denotes the median value. The whiskers go from first or third quartile to the minimum or maximum values, respectively. An exact p-value (p = 0.0003) was calculated using a two-tailed Mann–Whitney U test. Of note, the y-axis is in log-scale for display purpose only. b Kaplan-Meier estimate of OS, stratified according to high (n = 12) or low (n = 17) ccfDNA based on a ccfDNA concentration cut-off of 5.2 ng/ml plasma. c The efficiency of the combined targeted/sWGS sequencing strategy in detecting ctDNA in blood samples of CUP patients. d Scatter plot of baseline ccfDNA concentration versus baseline ctDNA content of unfavorable CUP patients (n = 34). Each dot represents a single patient; orange dots indicate CUP patients who radiologically respond to ICI treatment. Correlation analyses were performed based on Spearman’s correlation coefficient; a regression line was fitted. Of note, the log-log axes are for display purpose only. e Kaplan-Meier estimates of PFS and OS, according to high (n = 14) or low (n = 15) ctDNA based on a ctDNA level cut-off of 37.4 hGE/ml plasma. In (b, e), crosses denote censored observations, and for each time interval the number of patients at risk are indicated below the plots. Comparisons are made using a two-sided log-rank test, Cox proportional hazard regression modeling was used to calculate hazard ratio. 95% CI 95% confidence interval, HR hazard ratio, IQR interquartile range, hGE haploid genome equivalent. Source data are provided as a Source Data file.

