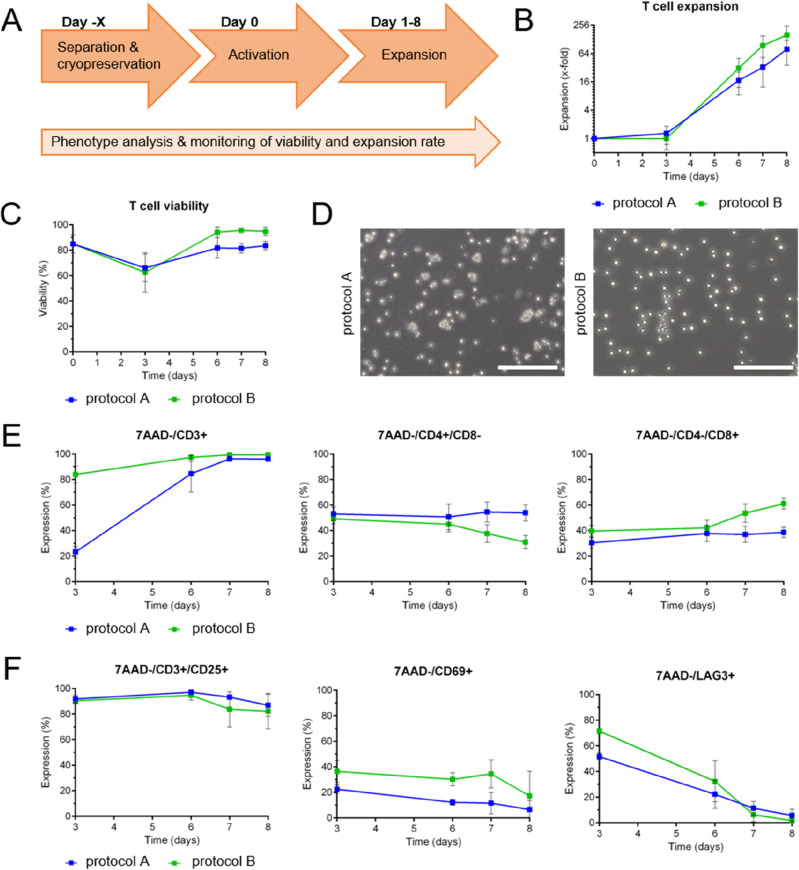
Figure 1.
Experimental workflow, expansion rate, viability, and phenotyping of primary T cells during an 8-day culture process comparing two different media protocols. (A) Lab-scale process of mRNA-based CAR-T cell generation using primary T cells spanning separation (day -X), activation (day 0), and expansion (day 1–8). (B,C) Comparison of T cell expansion and viability during the 8-day culture process using protocols A (blue) and B (green). N = 4 independent experiments were performed. Values are displayed as the mean ± SEM. (D) Microscopic analysis of T cell morphology on day 7 after activation. One representative image each is displayed showing larger, more heterogeneous cell shapes in protocol A (blue) and a homogeneous, round-shaped cell population by using protocol B (green). Scale bar shows 200 μm. (E,F) Flow cytometric analysis of T cells during the 8-day culture process using protocols A and B. The percentage of marker expression is plotted against time in days. Analysis of T cell subsets (E) and activation status (F) revealed differences for both protocols tested. N = 4 independent experiments were performed. Values are displayed as the mean ± SEM.

