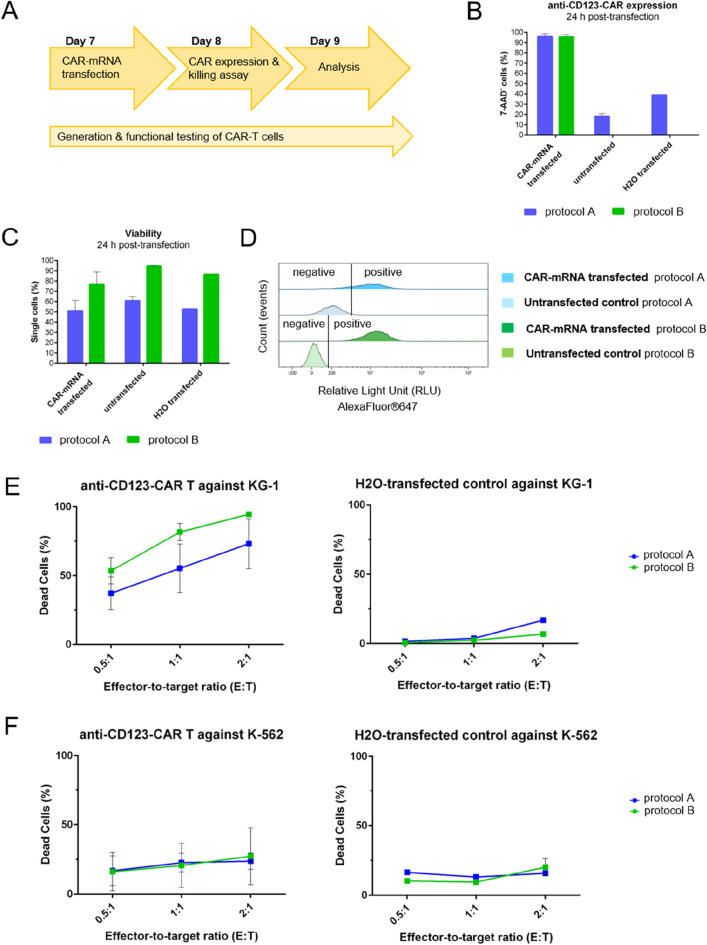
Figure 2.
Comparison of anti-CD123 CAR expression, CAR-T cell viability, and CAR-specific killing activity 24 h post-transfection. (A) Experimental workflow for modification of expanded T cells with anti-CD123-CAR-mRNA via electroporation (day 7), read-out of CAR expression 24 h postelectroporation (day 8) and functional testing of CAR-T cells with read-out on day 9. (B) Twenty-four h post-transfection, CAR expression of T cells cultured in medium of protocol A (blue) or protocol B (green) was determined via F(ab′)2 staining and flow cytometric analysis; n = 3 independent experiments of anti-CD123 CAR transfection were carried out. Untransfected cells (n = 2) and water-transfected cells (n = 1) were used as negative controls. Values are displayed as the mean ± SEM or mean ± SEM in the case of n = 1. (C) Viability of aCD123-CAR-T cells after transient transfection was determined by 7-AAD staining and flow cytometric analysis. Transfected as well as untransfected cells expanded with protocol A showed lower viability than (CAR)-T cells expanded with protocol B 24 h post-transfection. (D) Histograms of F(ab′)2 staining are clearly separated into F(ab′)2-positive and F(ab′)2-negative when CAR-T cells were cultured according to protocol B (light and dark green), while histograms of CAR-positive and CAR-negative T cells overlap when grown by using protocol A (light and dark blue). (E/F) The percentage of dead target cells eliminated by aCD123-CAR-T cells or water-transfected control T cells is blotted against E:T ratios of 0.5:1, 1:1, and 2:1. T cells cultured according to protocol A are shown as blue curves, and those cultured according to protocol B are shown as green curves. For aCD123-CAR-T effector cells, the results of n = 4 independent experiments carried out in technical triplicates are depicted. For process control, water-electroporated T cells with n = 1 as a control experiment in technical triplicates are shown. All values are displayed as the mean ± SEM or mean ± SEM in the case of n = 1.

