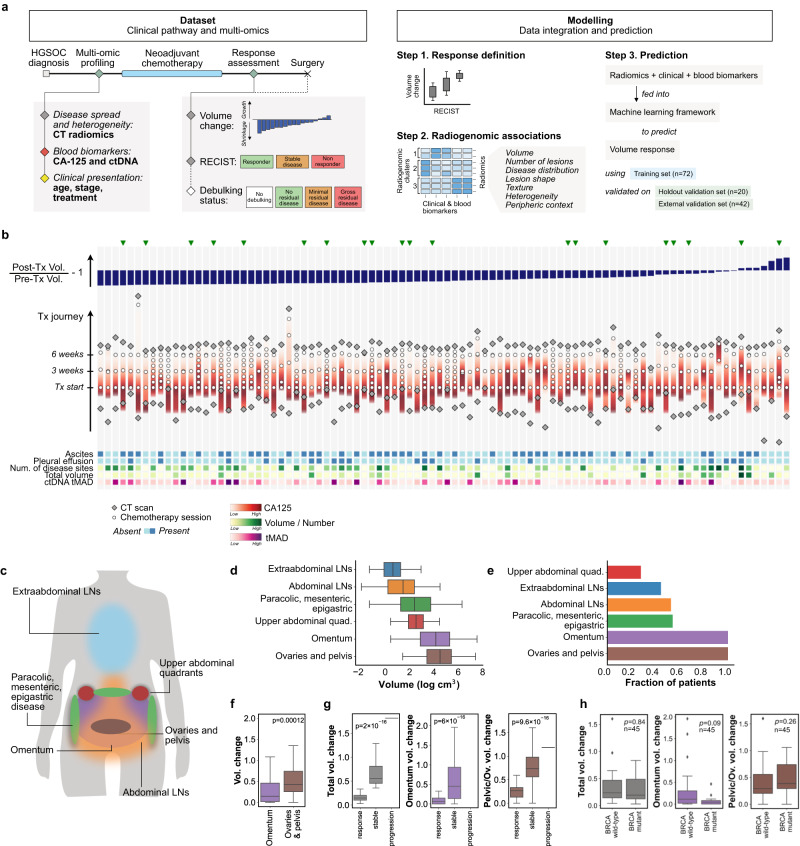
Fig. 1. Structure of the study and main characteristics of the training cohort.
a Key time points and variables in the dataset (left) and steps of the modelling strategy (right). See also Supplementary Fig. S1 for additional information. b Treatment courses of all 92 patients in the NeOV cohort, ordered by decreasing volumetric tumour response following NACT. Patients analysed in the hold-out validation set were randomly selected and are indicated with a green triangle. Treatment journeys progress vertically (bottom to top) and are aligned at the time of the first chemotherapy cycle. Additional biomarkers obtained at baseline are depicted in the bottom heatmap. c Sites of primary and metastatic disease in HGSOC. d Distribution of tumour volumes by site for patients in the training cohort. e Distribution of tumour sites by patient. f Volume changes of the omental and pelvic/ovarian disease for all patients in the training cohort. p value obtained from the two-sided Mann-Whitney U test. g Total and site-specific volume change stratified by RECIST 1.1 response status for the training cohort. p value obtained from the point biserial correlation coefficient, two-tailed. h Total and site-specific volume change stratified by BRCA mutation status. These figures are restricted to the n = 45 patients in the training cohort for whom the BRCA mutation status was known. p value obtained from the two-sided Mann-Whitney U test. Boxes indicate the upper and lower quartiles, with a line at the median. Outliers are shown as circles and identified via the interquantile range rule. Source data are provided as a Source Data file.

