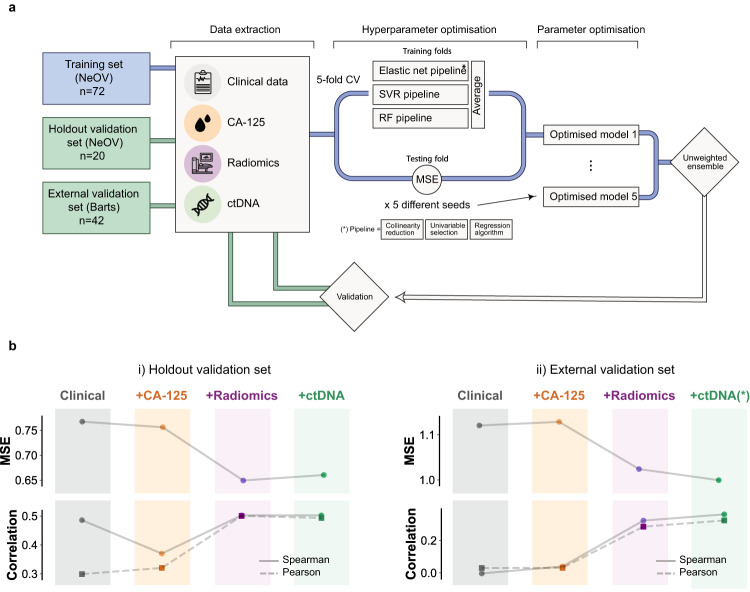
Fig. 3. Training scheme and validation results for the IRON machine learning framework.
a Schematic of the machine learning framework for model training and validation. b Validation of the discriminative power of predictive models in the hold-out (left) and external validation cohorts (right), for models containing, from left to right, clinical, clinical+CA-125, clinical+CA-125+radiomics, and clinical+CA-125+radiomics+ctDNA features, respectively. The metrics are mean square error (MSE, top) and Spearman (continuous) or Pearson (dashed) correlation (bottom). The magnitude of the mean squared error (MSE) is comparable to the standard deviation of the volumetric response (Supplementary Table S9). ctDNA values in the external validation cohort were imputed using training set averages. Source data are provided as a Source Data file.

