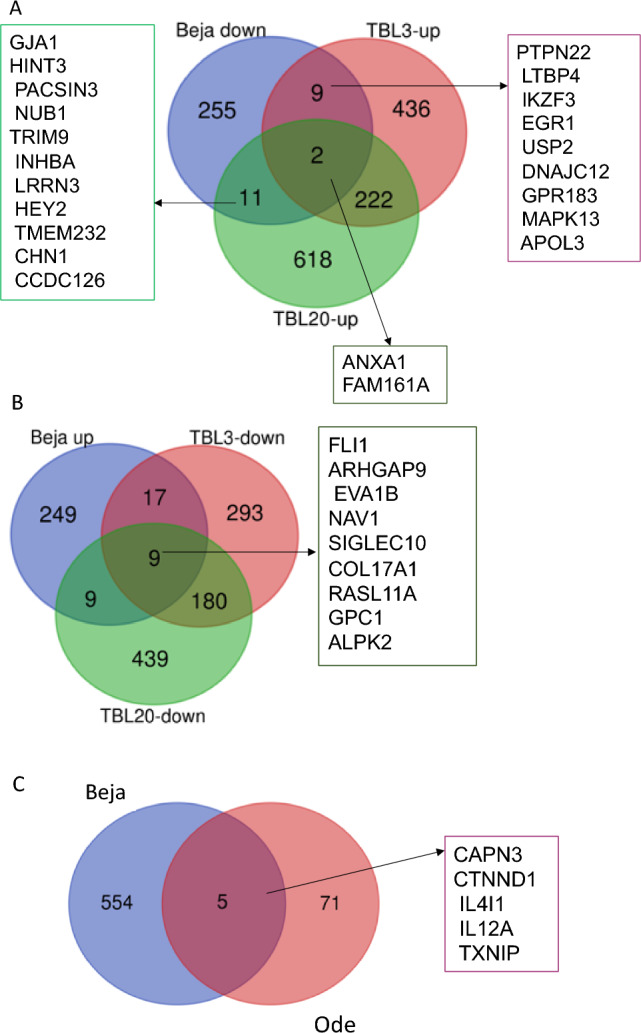
Figure 4.

Venn diagrams showing the genes inversely differentially expressed in Beja high passage (attenuated) compared to TBL3, TBL20 and attenuated Ode. Panel A showing an inverse comparison of genes down-regulated in attenuated Beja vs genes up-regulated by infection; Panel B showing genes up-regulated in Beja vs genes down-regulated in TBL and panel C showing the common genes in attenuated passage between Beja and Ode cell lines.
