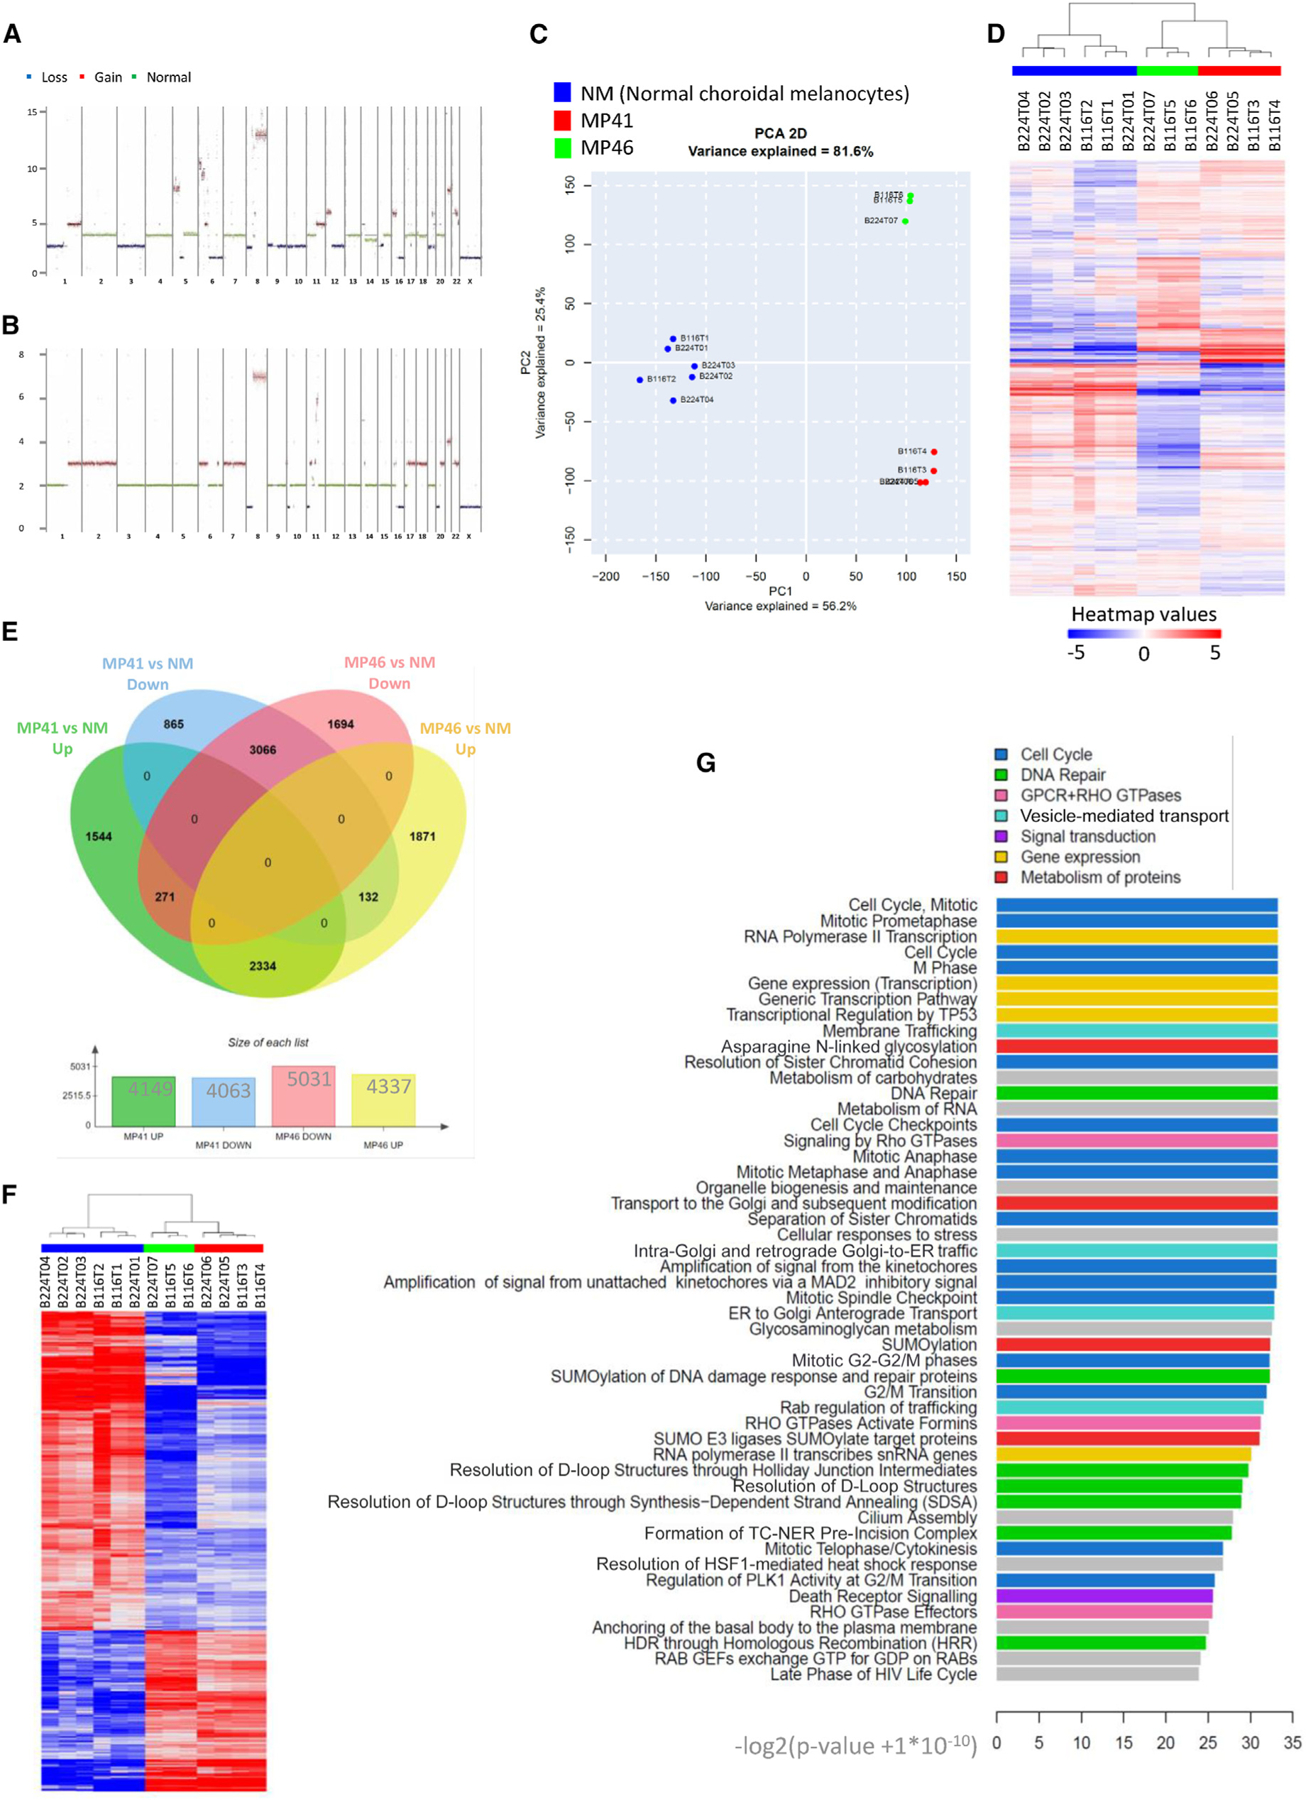
Figure 2. Genome and gene expression global overview.

(A and B) MP41 (A) and MP46 (B) copy number profile established from whole-genome sequencing. Losses, gains, and normal regions are colored respectively in blue, red, and green.
(C) Principal component analysis of RNA-seq of six normal choroidal melanocyte samples (blue), four preparations of MP41 UM cells (red). and three preparations of MP46 UM cells (green).
(D) Hierarchical clustering of the same profiles.
(E) Differential gene expression analysis of MP41 vs. NM and MP46 vs. NM to identify genes with a Log2 fold change greater than 1.5 and a p value lower than 0.05.
(F) Heatmap of commonly regulated genes in MP41 vs. NM and MP46 vs. NM.
(G) 50 most highly regulated pathways by reactome analysis of commonly regulated genes listed according to the significance (−log2 [p value + 1E-10]).
