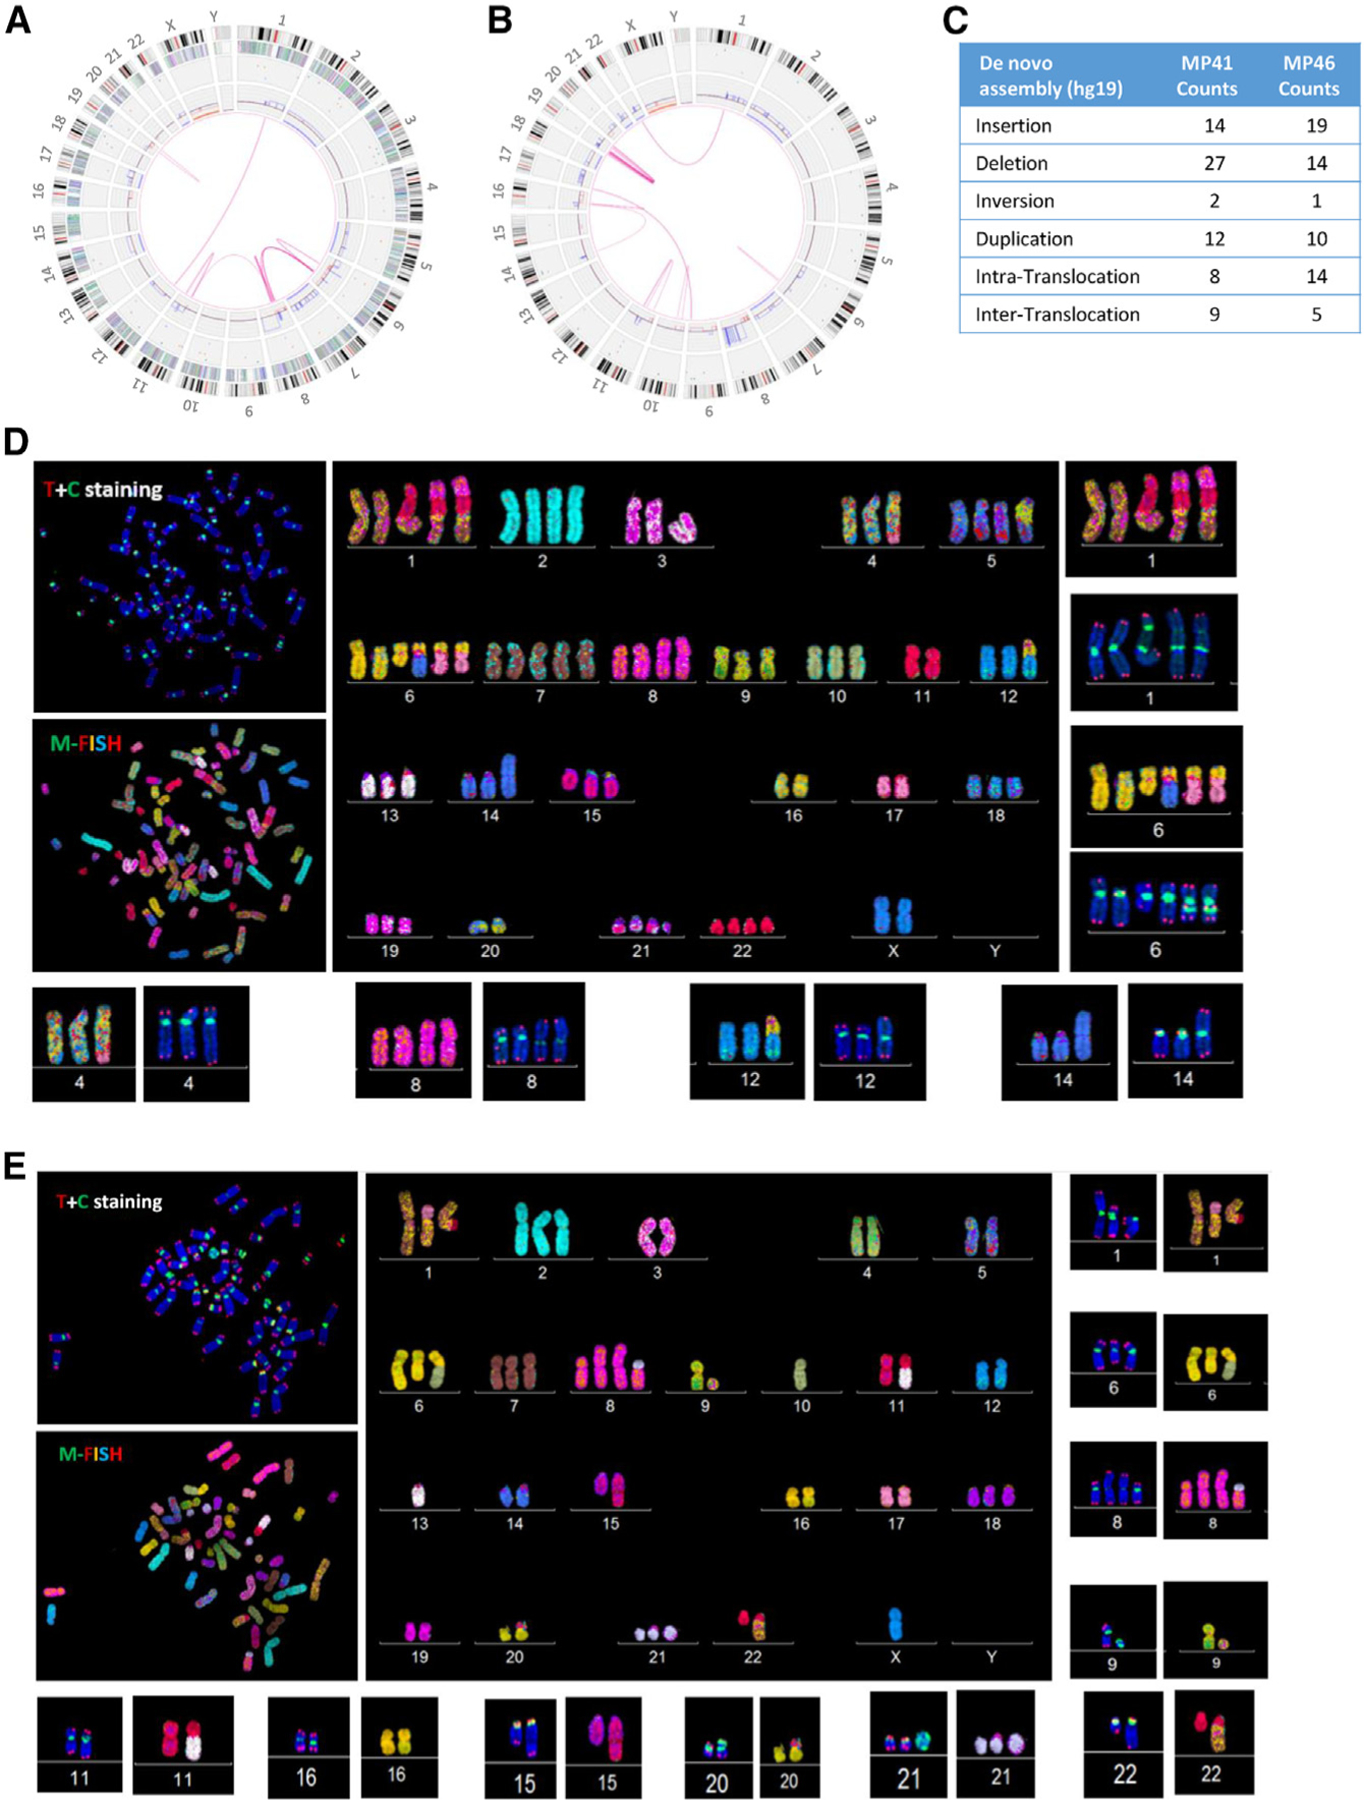
Figure 3. DNA optical mapping and FISH analysis of MP41 and MP46.

(A and B) Circos plot of aberrations in (A) MP41 and (B) MP46. From the central to the periphery of the circos plot: whole-genome view summarizes intra- and inter-chromosomal translocations (pink lines), copy number gains and losses are listed on the first internal layer of the circos, and SVs (insertion, deletion inversion, and duplication) are labeled as colored dots in the intermediate layer of the circos. Gene density, cytobands, and chromosomes comprise the outer layers of the circos.
(C) Number of insertions, deletions, inversions, and duplications and intra- and inter-translocations are detailed for MP41 and MP46 defined by Bionano optical mapping.
(D and E) Telomere and M-FISH from analysis of (D) MP41 and (E) MP46 are derived from two different FISH analyses. Upper left panels show telomere (red signal) and centromere (green signal) staining and are counter labeled with DAPI (blue). Lower left panels show M-FISH analysis. Main panels correspond to the karyotype view.
