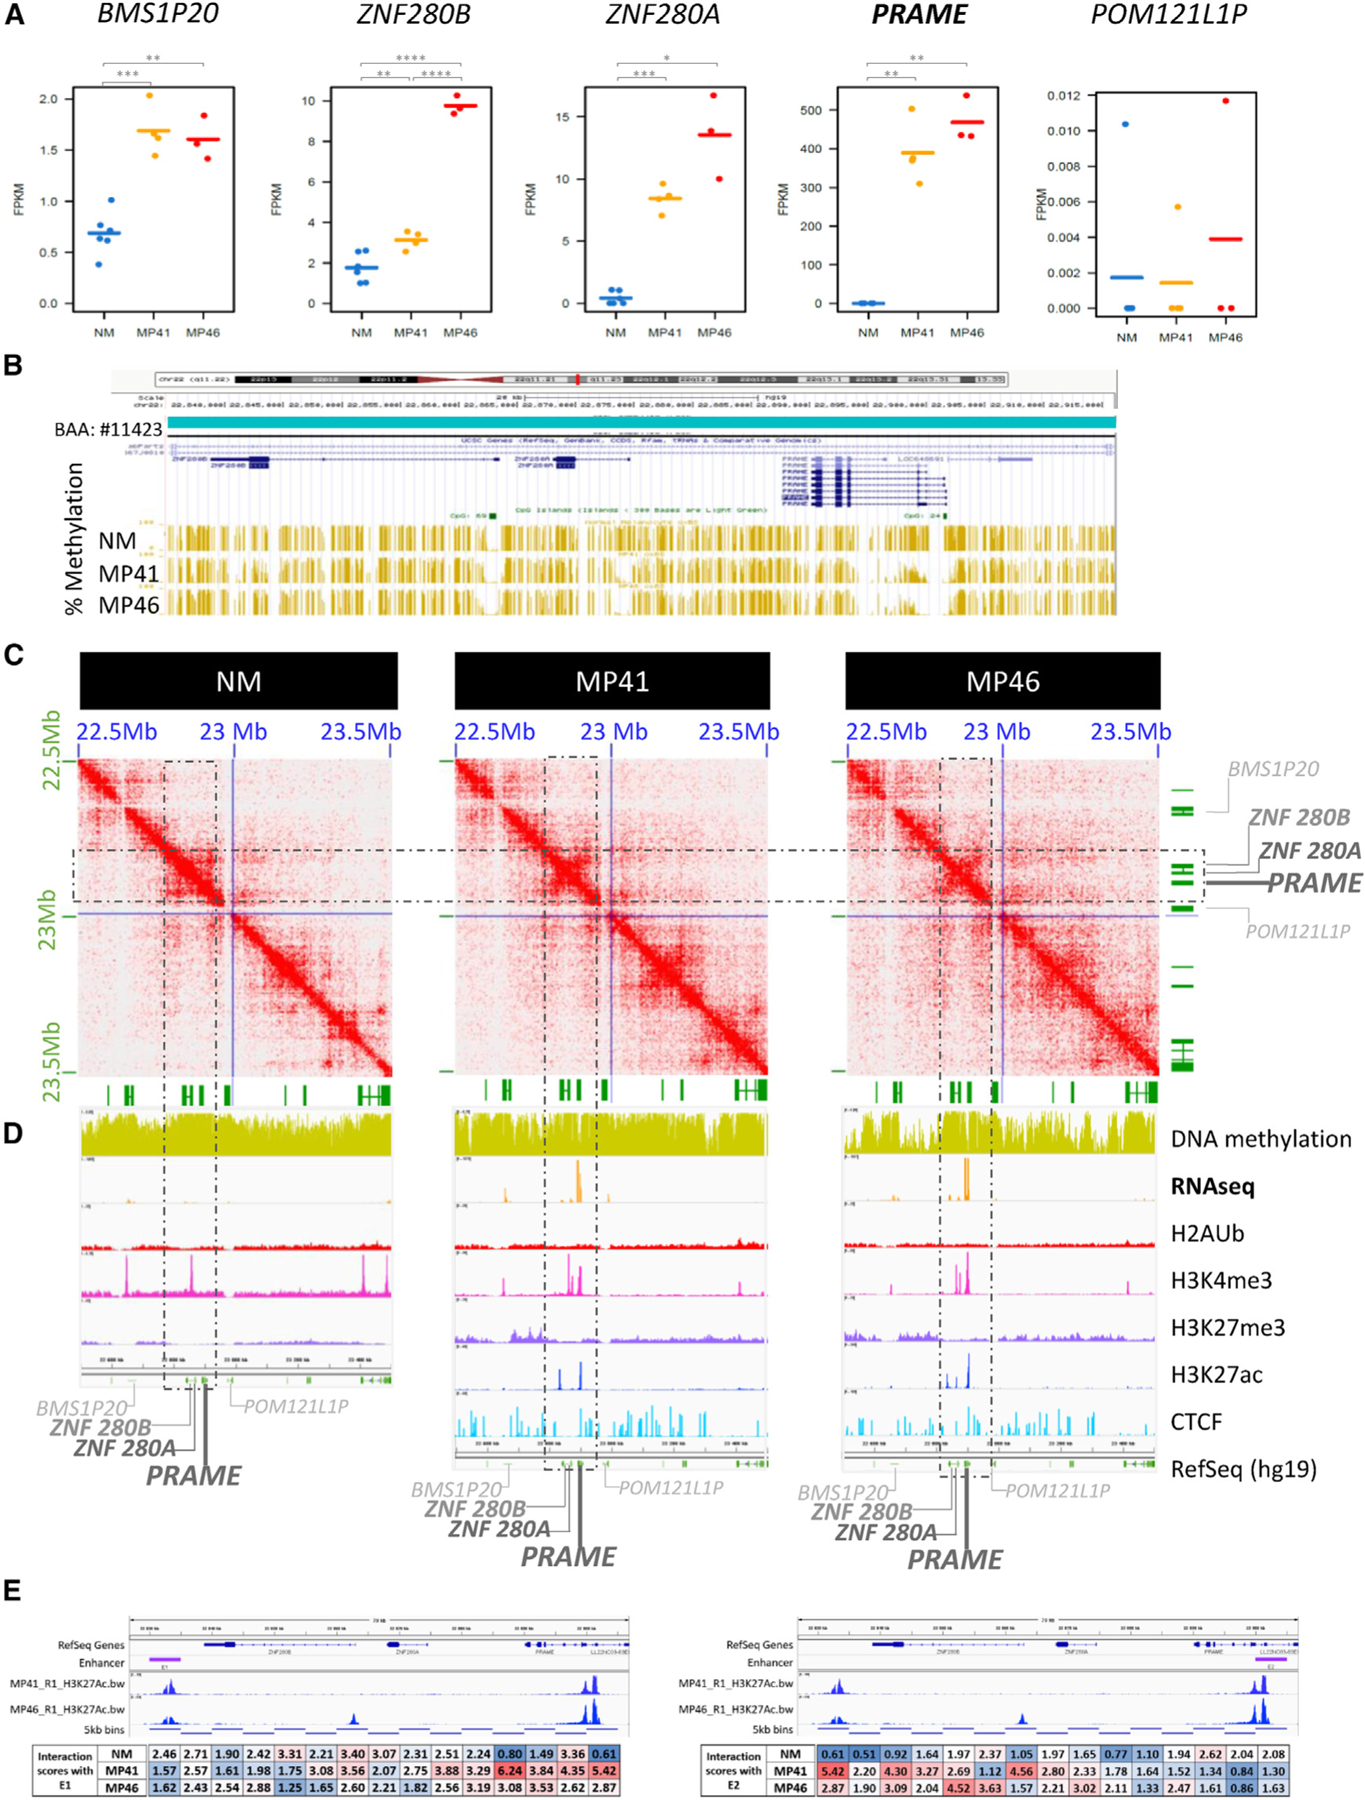
Figure 6. Multi-omics analysis of PRAME locus.

(A) Gene expression of PRAME and its neighbors as BMS1P20, ZNF280B, and ZNF280A upstream genes and POM121LP downstream. RNA-seq data of NM, MP41, and MP46 replicates (FPKM).
(B) UCSC Genome Browser view (hg19) of percentage of DNA methylation (golden bars).
(C) DNA contacts maps of NM, MP41, and MP46 at 5-kb resolution in PRAME TAD (blue square).
(D) UCSC Genome Browser view of the PRAME locus showing DNA methylation, RNA-seq (log2), H2AUb, H3K4me3, H3K27me3, H3K27Ac, CTCF, and RefSeq genes.
(E) H3K27Ac marks and HiC interaction of PRAME promoter with potential distal enhancer E1. HiC interactions anchored in E1 (left) and E2 (right) quantified in boxes under genomic locus.
