
FIGURE 1.
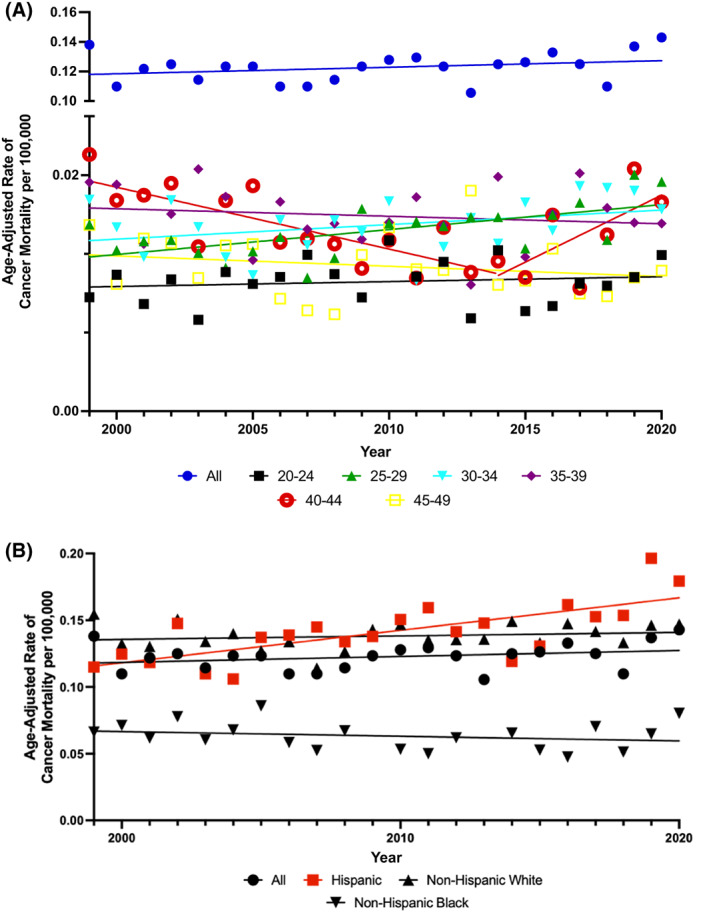
Age‐adjusted rates of testicular cancer‐specific mortality (TCSM) per 100 000 Population by (A) 5‐year age group and (B) race and ethnicity. Trends in age‐adjusted TCSM rates by (A) 5‐year age group; (B) race and ethnicity. Solid lines represent Joinpoint modeled rates and markers represent observed rates. Mortality data are from Centers for Disease Control and Prevention (CDC) Wide‐ranging Online Data for Epidemiologic Research (WONDER) database.