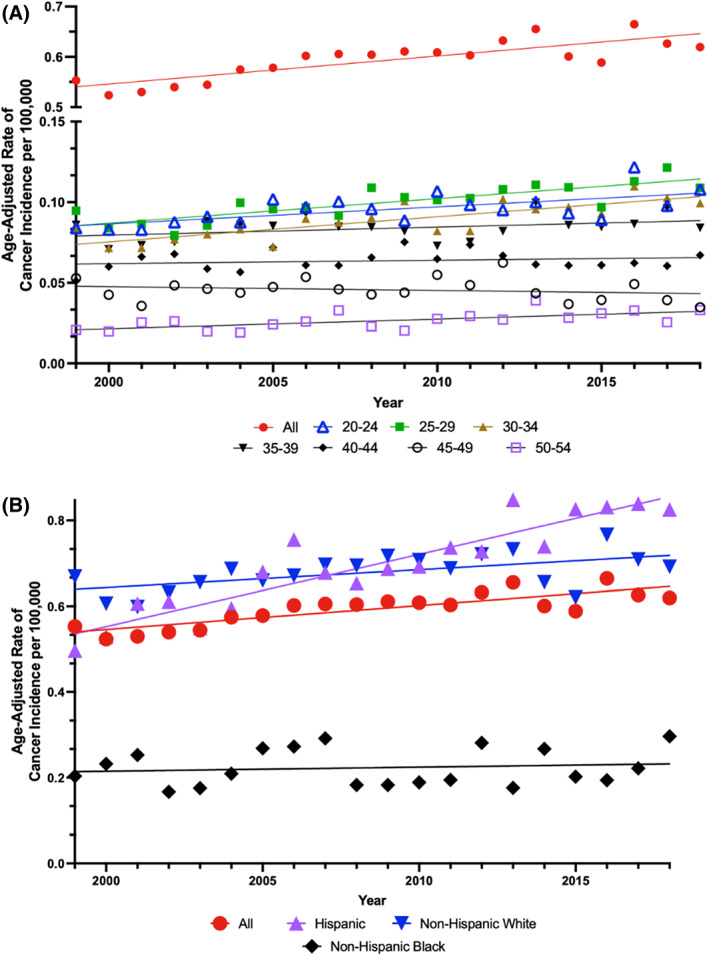
FIGURE 2.

Age‐adjusted rates of metastatic testicular cancer‐specific incidence per 100 000 population by (A) 5‐year age groups and (B) race and ethnicity. Trends in metastatic TCSI by (A) 5‐year age groups and (B) race and ethnicity. Solid lines represent Joinpoint modeled rates and markers represent observed rates. Incidence data are from the North American Association of Central Cancer Registries (NAACCR) database.
