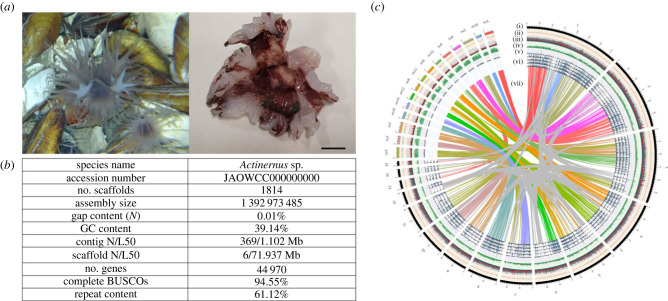
Figure 1.
(a) Photographs of the Actinernus sp. on site (left) and the sampled specimen (right, scale bar = 1 cm); (b) genome statistics of Actinernus sp.; (c) circos plot of the genome assembly of Actinernus sp. in comparison with Nematostella vectensis, with tracks (i–vii) specified as follows: (i) chromosomes; (ii) GC content percentage (greater than 41.9% in green; less than 37.7% in red); (iii) distribution of repeat elements where DNA transposons, LTRs, LINEs, SINEs, other repeats and unclassified repeats are coloured in red, green, blue, purple, pink and grey, respectively; (iv) gene density; (v) exon density; (vi) transcriptome reads coverage of trunk and tentacle samples; (vii) syntenic blocks showing synteny conservation with N. vectensis in colours and self-syntenic regions in grey. All tracks were plotted with 100k window size except tracks (iv) and (v) where 200k window size was used.

