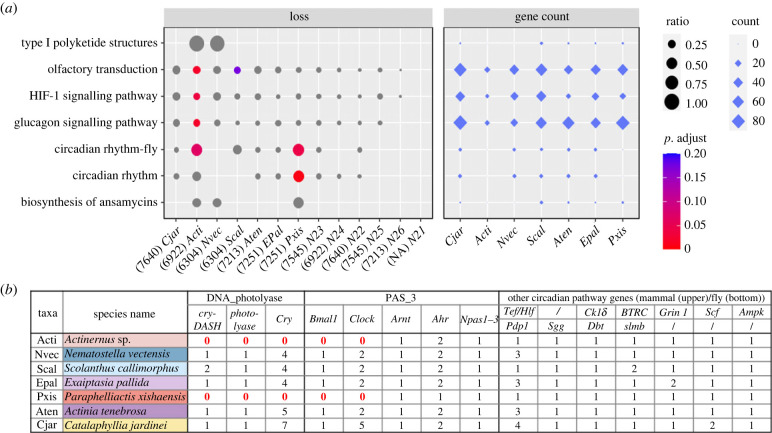
Figure 4.
(a) Enriched KEGG pathways of gene family loss (left panel) and gene count in Hexacorallia taxa. The gene ratio was defined by the number of gene loss at each taxon/internode divided by the total number of genes in its ancestral state. P-value was calculated to test significantly over-represented genes using the hypergeometric model and was adjusted using the Benjamini and Hochberg method (BH) and (b) gene count table of circadian rhythm pathway and related gene families with DNA photolyase and PAS fold (PAS_3) domains.

